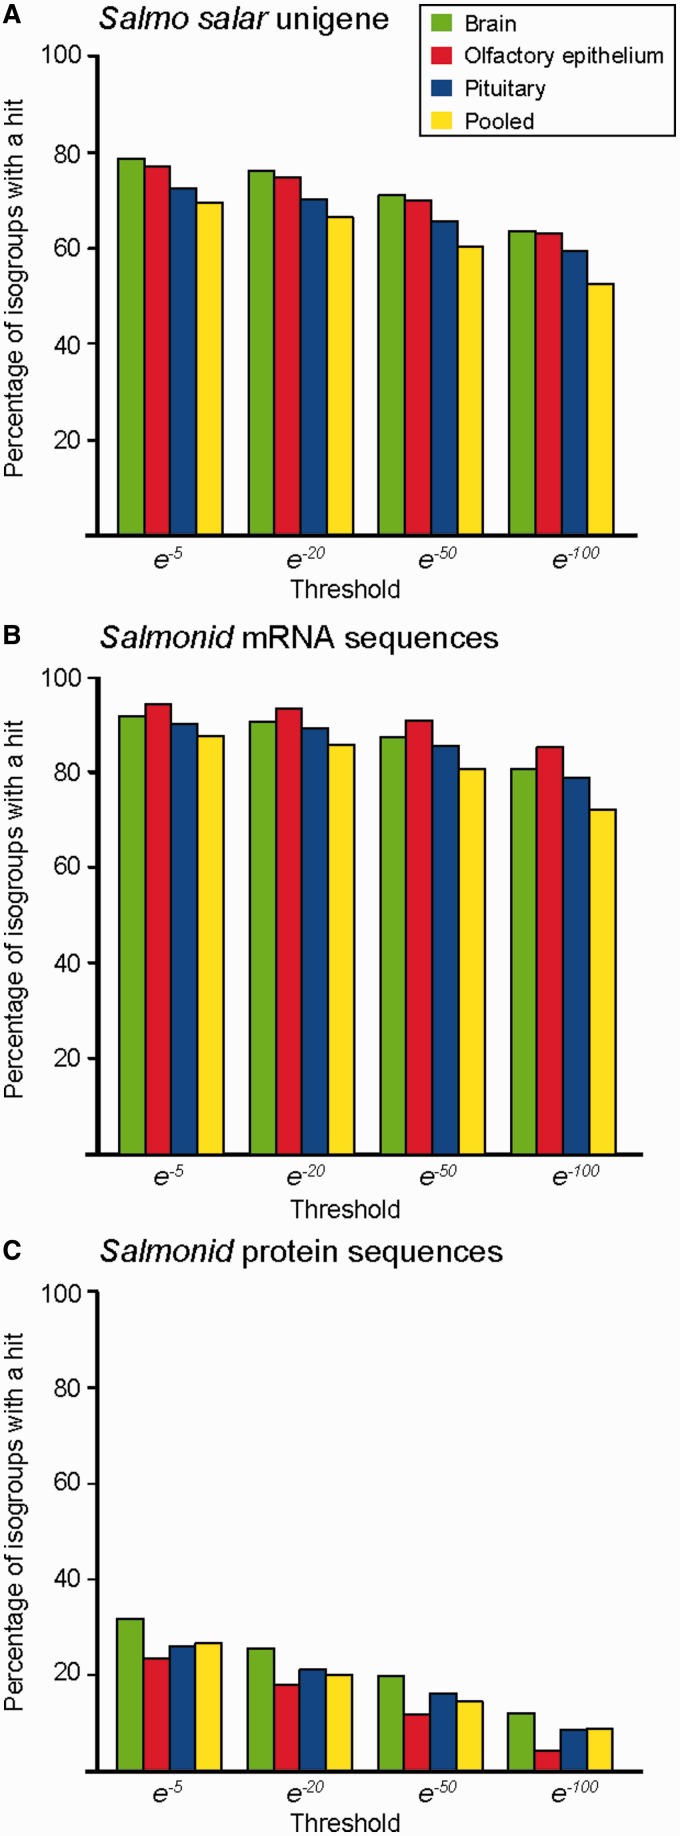
Fig. 4.—
Congruence of genes expressed in each transcriptome assembly with existing genomic resources. (A) Salmo salar Unigene database (Pontius and Schuler 2003), (B) GenBank mRNA database for salmonids (Benson et al. 2006), and (C) NCBI protein database for salmonids (Benson et al. 2006). The percentage of isogroups with significant BLAST hits is given on the y axis, and the E-value threshold is given on the x-axis.

