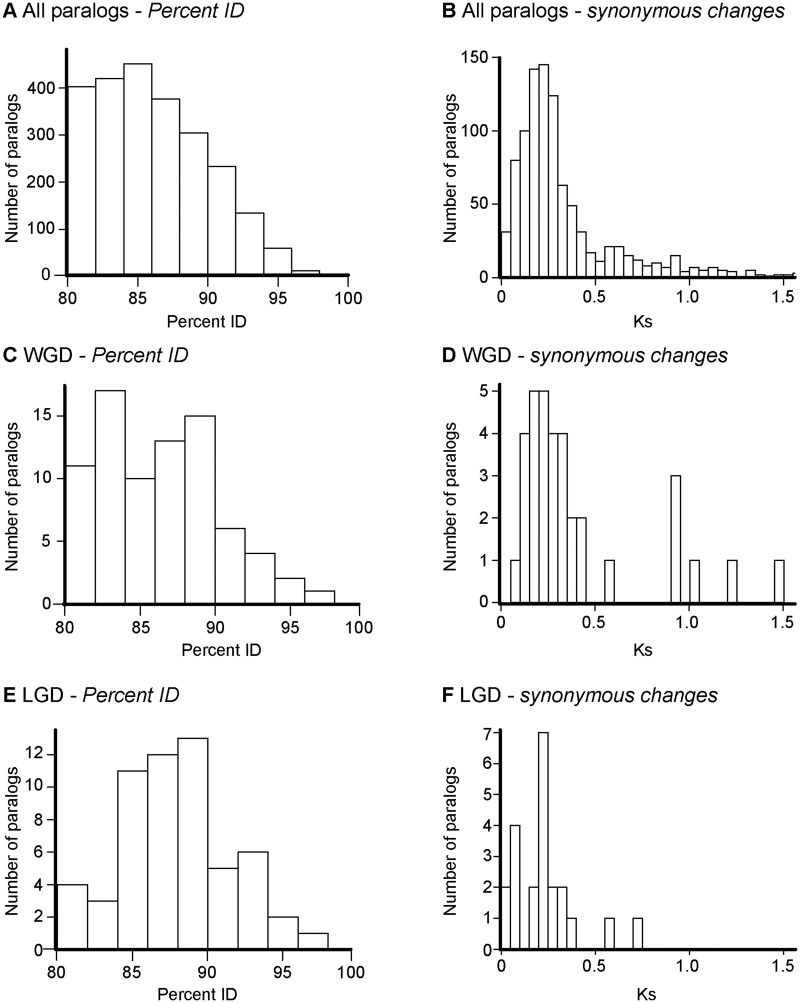
Fig. 5.—
Similarity between paralog sequences in Salmo salar expressed in the transcriptomes presented here (minimum percent ID = 80%, minimum alignment length = 300 bp). (A, B) All 2,394 putative paralog pairs. (C, D) Paralog pairs where both sequences were assigned to the same chromosome (LGDs). (E, F) Paralog pairs where the sequences were assigned to the different chromosomes (WGDs). Both percent ID within paralog pairs (A, C, E) and synonymous substitution (Ks) rate (B, D, E) are given. For ease of presentation, Ks values greater than 1.5 are not shown (see supplementary figs. S5.1–S5.8, Supplementary Material online). The analyses were repeated at a range of thresholds (supplementary figs. S5.1–S5.8, Supplementary Material online).

