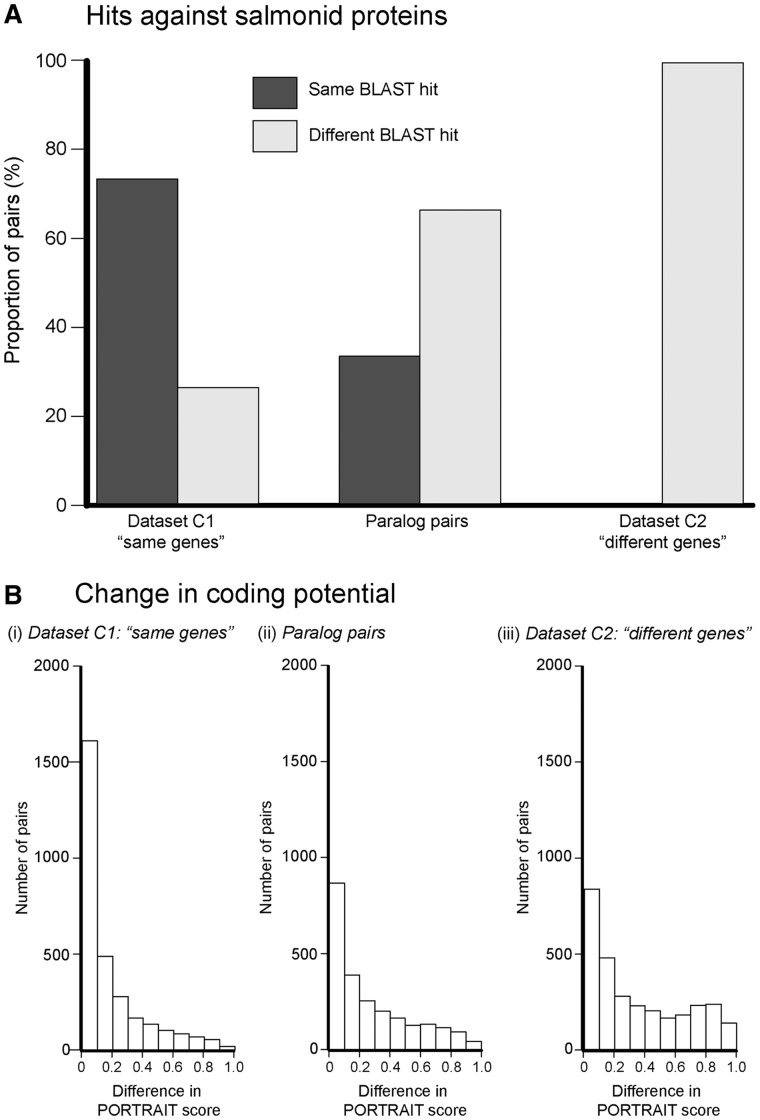
Fig. 8.—
Analyses of functional changes in paralog pairs. (A) BLAST hits for the two control data sets (C1: “same genes” and C2: “different genes”) and the real data set of paralog pairs (identified in WGD and LGD Events in S. salar), When compared against an NCBI salmonid protein database. The proportion of pairs is given on the y axis. In the majority of sequence pairs, neither sequence had a positive BLASTx hit and they are not shown here (see fig. 4C). This analysis was repeated with the salmonid mRNA from GenBank, the S. salar Unigene database, and the UniProt protein database, and the same results were obtained (supplementary fig. S6.1, Supplementary Material online). (B) The absolute difference in coding potential for each sequence pair across the three data sets (represented by absolute difference within paralog pairs in their respective PORTRAIT scores) (Arrial et al. 2009).

