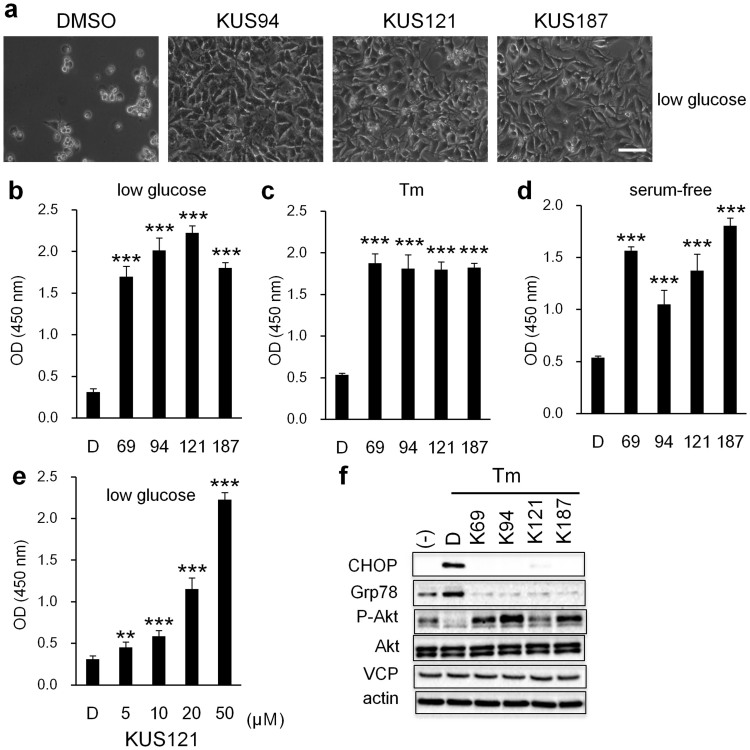
Figure 2. Prevention of cell death and ER stress by KUSs.
(a) Photographs of HeLa cells, cultured with DMSO (DMSO) or KUSs (KUS94, KUS121, and KUS187, 20 μM each) for 41 hours in low glucose (0.2 g/l) medium. Scale bar, 100 μm. (b–e) WST (water-soluble tetrazolium salts) values reflecting relative live cell numbers are shown, as optical density (OD) at 450 nm. Error bars indicate SD. (b) WST values of HeLa cells, cultured in low glucose (0.2 g/l) with DMSO (control) or KUSs (50 μM for KUS121; 20 μM for KUS69, KUS94, and KUS187, n = 3) for 41 hours. (c) Cell viability, indicated by WST values of HeLa cells, cultured with tunicamycin (Tm) (0.2 μg/ml) for 41 hours with KUSs (20 μM each, n = 3). (d) WST values of HEK293 cells, cultured under serum-free conditions for 65 hours with DMSO (control) or KUSs (20 μM each, n = 3). *** P < 0.001, vs. DMSO control (Dunnett's test). (e) WST values of HeLa cells, cultured in low glucose (0.2 g/l) medium with different concentrations of KUS121 (5, 10, 20, and 50 μM, n = 3) for 41 hours. ** P = 0.008, *** P < 0.001, vs. DMSO control (Dunnett's test). (f) Western blot analysis of HeLa cells, treated with tunicamycin (Tm, 0.5 μg/ml) with DMSO (control) or KUSs (50 μM each, KUS69, KUS94, KUS121, and KUS187) for 5 hours. Complete scans of the different blots are presented in Supplementary Fig. 8.

