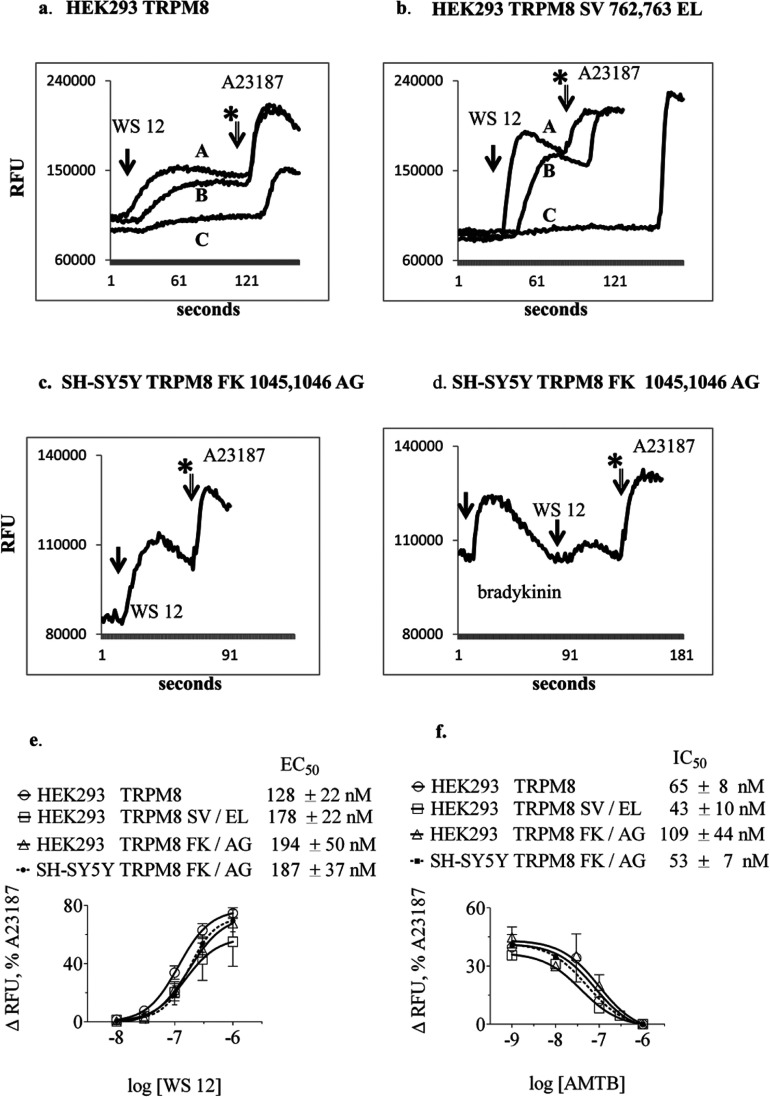
Figure 1. Representative fluorescence intensity traces from Fluo-3-loaded cells measuring real-time intracellular Ca2+ responses to TRPM8 agonist.
Relative fluorescence intensity units (RFU) are plotted versus time (s). (a) HEK-293 cells expressing human TRPM8 prepared in the presence of increasing concentrations of probenecid (A: 0.13 mM, B: 1.3 mM, C: 2.5 mM) treated with 40 nM WS 12 (injected at first arrow), then 2 μM A23187 (arrow with asterisk, indicated for first trace). Exposure to probenecid suppressed the response to WS 12. (b) Example Ca2+ transient traces showing dose-dependent WS 12 activation of TRPM8 SV 762,763 EL double residue mutant expressed in HEK-293 cells (A: 1 μM, B: 100 nM, C: 30 nM WS 12). (c) The Ca2+ transient response to 125 nM WS 12 in SH-SY5Y cells transfected with TRPM8 was similar in magnitude to the response to 2 nM bradykinin-mediated activation of endogenous bradykinin receptors, (d) (e) Dose–response curves derived from measurements of peak intracellular Ca2+ fluorescence in HEK-293 and SH-SY5Y cell clones expressing TRPM8 constructs. Estimation of EC50 for WS 12 (mean±S.E.M., n=3 independent experiments each performed in triplicate). Mean EC50 values for reference sequence and mutant TRPM8 were not statistically significant in either cell line. (f) Estimated IC50 values for TRPM8 antagonist AMTB determined using a constant dose of 150 nM WS 12, (mean±S.E.M., n=3). Mean IC50 values for wild-type and mutant TRPM8 were not statistically significant in either cell type.

