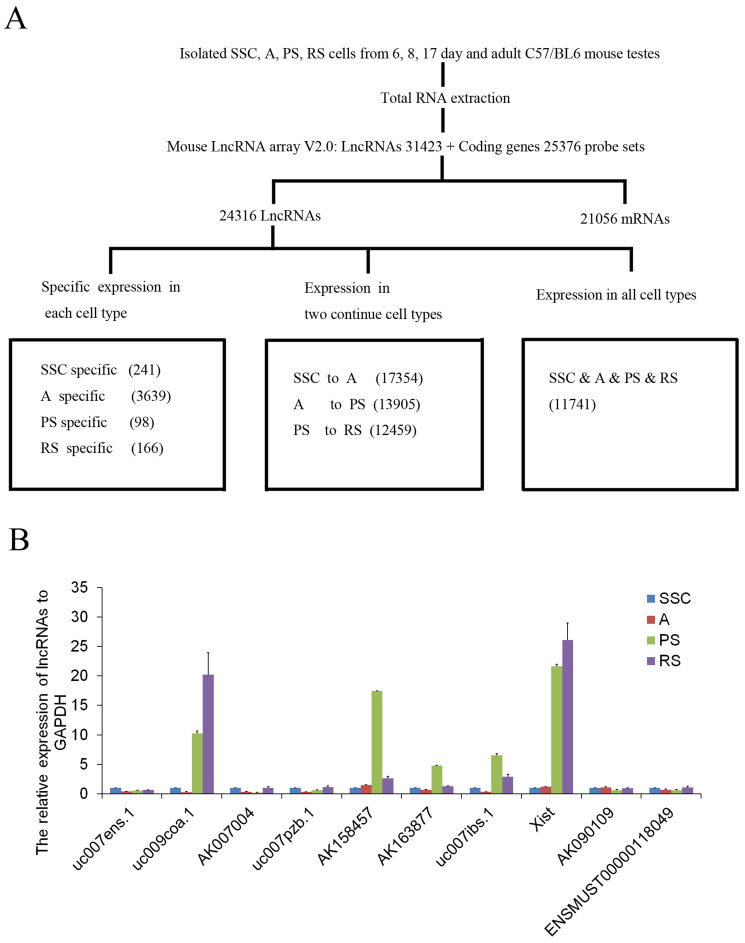
Figure 2. Schematic summary of lncRNAs/mRNAs expression profile analysis and validation of representative lncRNA expression.
(A), Schematic overview of the experimental design for lncRNAs/mRNAs microarray analysis. (B), Total RNA was extracted from isolated male germ cells and then subjected to real-time PCR analysis for lncRNAs (uc007ens.1, uc009coa.1, AK007004, uc007pzb.1, AK158457, AK163877, uc007ibs.1, Xist, AK090109, ENSMUST00000118049) expression. These lncRNAs expression levels were normalized to endogenous GAPDH mRNA. Data shown are the mean ± SEM of three separate experiments performed in triplicate.

