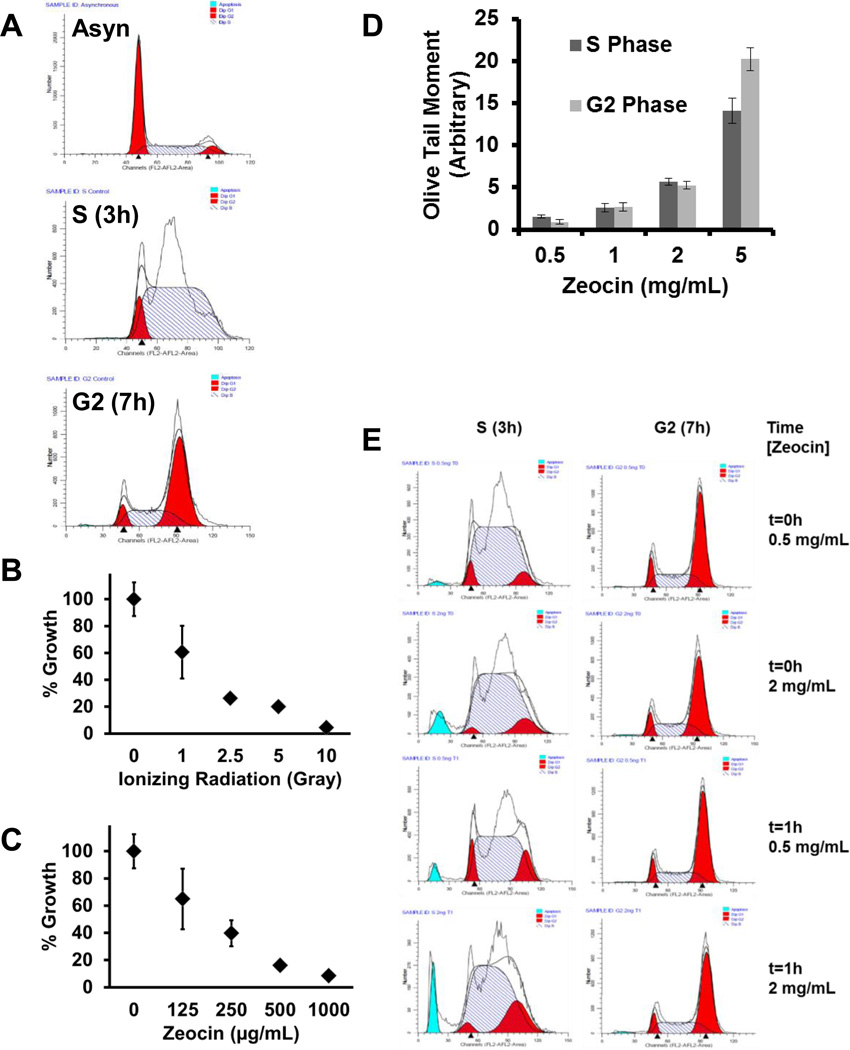
Fig. 1. Characterization of reagents for experimental design.
(A) Representative flow cytometry data of cell cycle timing. 1×10⁶ cells were treated with (B) IR and (C) Zeocin™ at the indicated doses and concentrations and percentage growth was measured. (D) The DNA damage of cells was determined using a comet assay and a bar graph of the comet Olive tail moment (% DNA in tail x tail length) is presented. Images of the comet assay are included in Supplementary Fig. S1. (E) The cell cycle distribution of cells at t0 and t1 post treatment with Zeocin™ (0.5 mg/mL or 2 mg/mL) was analyzed by flow cytometry. For the flow data curve fitting, G1 is the red peak on the left, S is blue striped and G2 is the red peak on the right. The solid blue peak is fragmented DNA.

