
Figure 1.
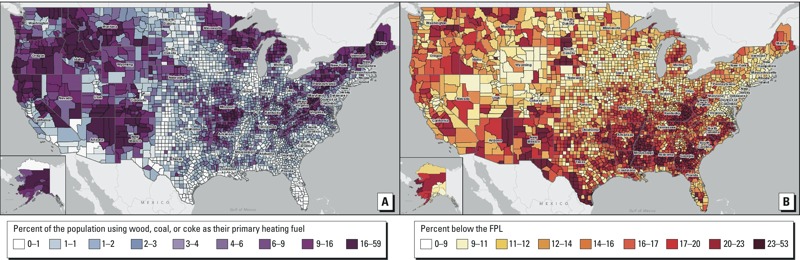
(A) Map of solid-fuel use by county in the United States, shown as the percentage of occupied housing units using wood, coal, or coke as the primary heating fuel (range, 0–59 in nine quantiles). (B) Map showing the percentage of people below the federal poverty level (FPL) in nine equal quantiles. Data from ACS 5 Year Estimate 2006–2010 (U.S. Census Bureau 2012).