
Figure 1.
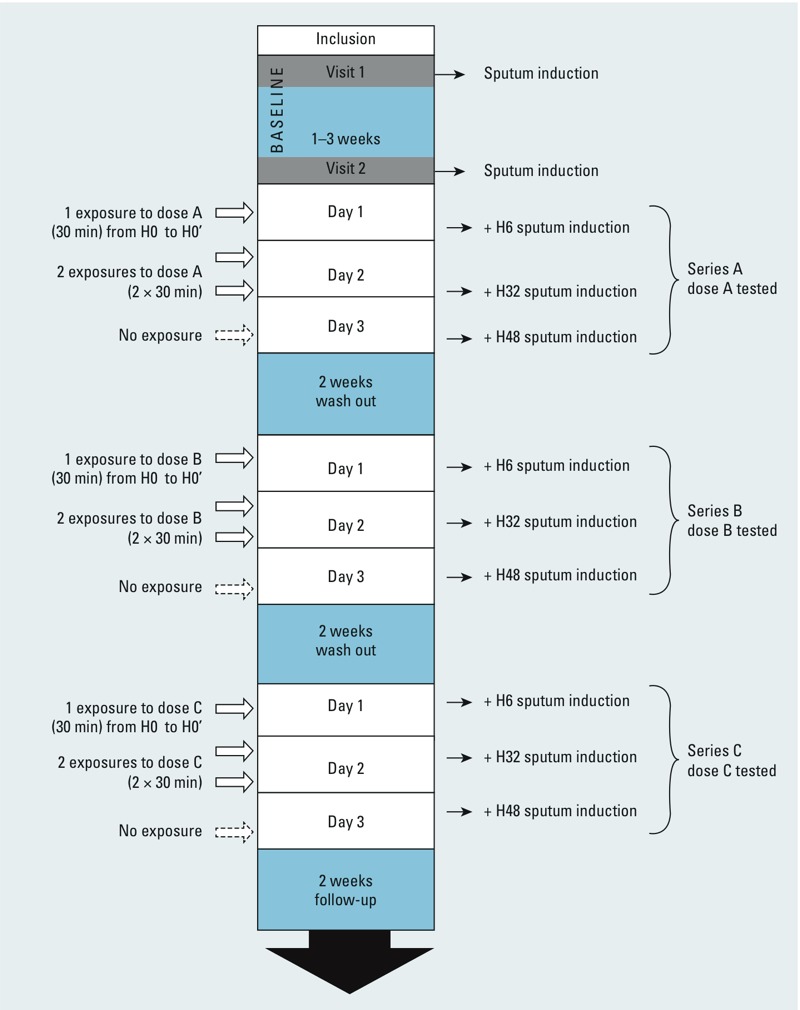
Flow diagram of the study period for each participant. Abbreviations: H0, immediately before 1st exposure (day 1); H0’, immediately after 1st exposure (day 1); H6, 6 hr after H0’ (day 1); H32, 32 hr after H0’ (day 2); H48, 48 hr after H0’ (day 3). The dose order was attributed randomly; so, series A, B, and C corresponds to clean air, 200-ppb NO2, or 600-ppb NO2 exposure.