Figure 2.

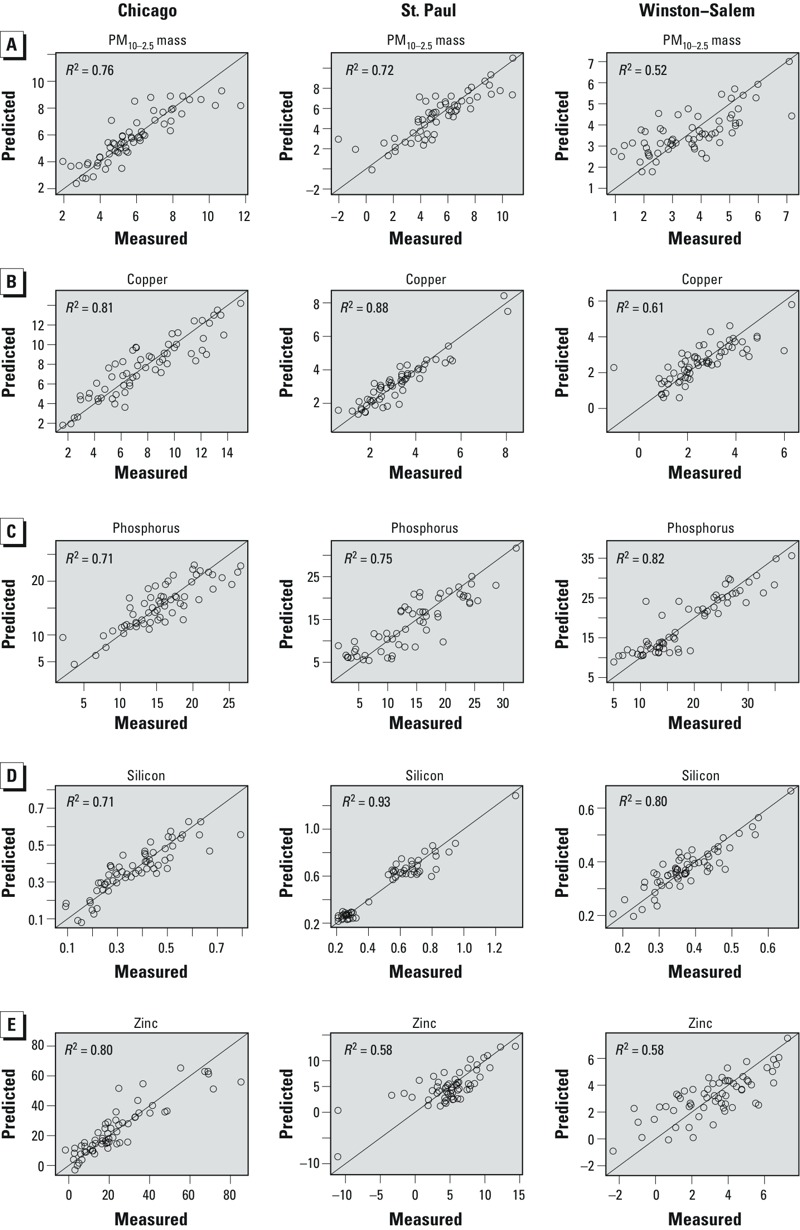
Scatter plots showing observations and the predictions from the “best” LUR models by city and species: PM10–2.5 (A), copper (B), phosphorus (C), silicon (D), and zinc (E). R2 = square of correlations between measurements and predictions.

Scatter plots showing observations and the predictions from the “best” LUR models by city and species: PM10–2.5 (A), copper (B), phosphorus (C), silicon (D), and zinc (E). R2 = square of correlations between measurements and predictions.