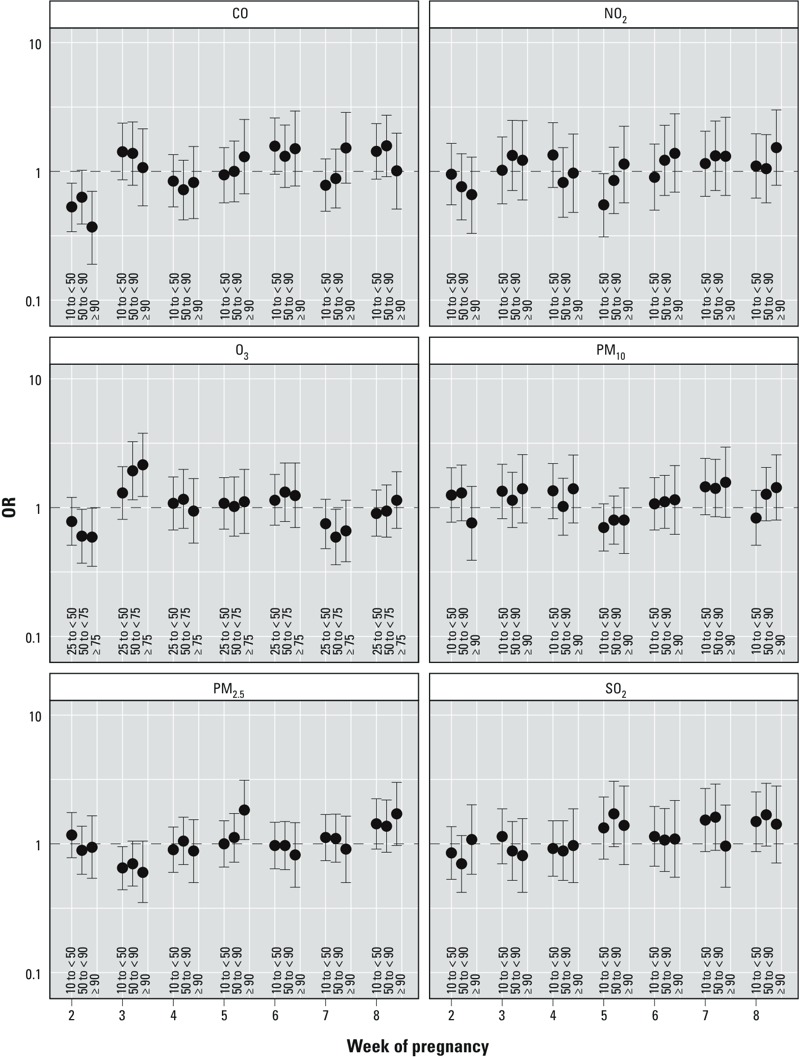
Figure 2.

Estimated adjusted ORs and 95% CIs of pulmonary valve stenosis for categorical measures of 1-week averages of daily maxima/24-hr measures of criteria air pollutants, plotted for weeks 2–8 of pregnancy, National Birth Defects Prevention Study 1997–2006 (for PM2.5, 1999–2006). ORs were estimated from hierarchical regression models. First stage was a polytomous logistic model, adjusted for maternal race/ethnicity, age, educational attainment, household income, maternal smoking status and alcohol consumption during early pregnancy, nativity, and site-specific heart defect ratio. Second stage was a linear model with indicator variables for defect, defect grouping, and level of exposure. For all pollutants except O3, the three categories of exposure are as follows: 10th centile to < 50th centile, 50th centile to < 90th centile, and ≥ 90th centile, with the referent level being < 10th centile among controls. For O3, the three categories of exposure were 25th to < 50th centile, 50th centile to < 75th centile, and ≥ 75th centile, with the referent grouping being < 25th centile. Pollutant levels that define the category cut points are provided in Table 2. See Supplemental Material, Table S4, for corresponding numeric data.
