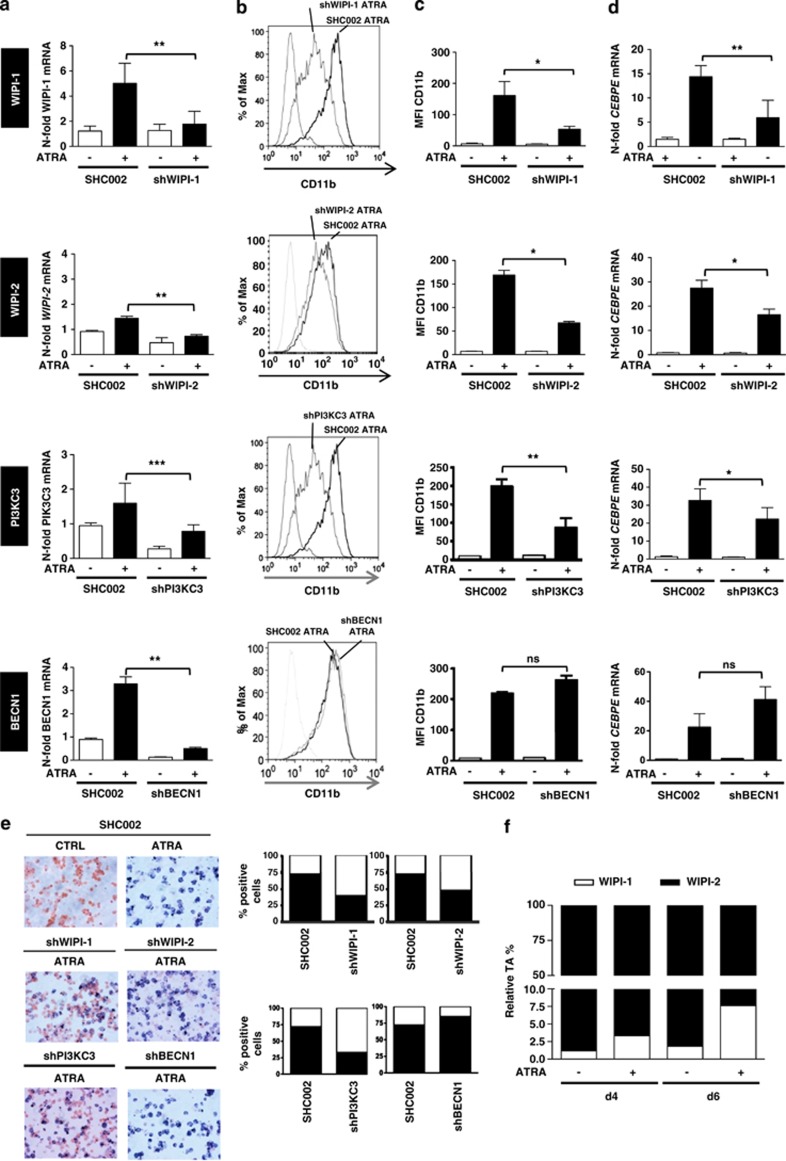
Figure 3.
Impaired neutrophil differentiation in NB4 WIPI-1, WIPI-2, PI3KC3 but not in BECN1 knockdown cells. (a) SHC002, shWIPI-1, shWIPI-2, shPI3KC3 and shBECN1 expressing NB4 cells were differentiated for 4 days and knockdown efficiency was measured by qPCR. (b) Neutrophil differentiation was assessed by measuring CD11b surface expression with FACS analysis, a representative CD11b histogram is shown. (c) Bar graphs of the median fluorescence intensity of three independent experiments are shown. (d) CEBPE mRNA expression was measured by qPCR in SHC002, shWIPI-1, shWIPI-2, shPI3KC3 and shBECN1 expressing NB4 cells upon 1 μM ATRA treatment after 4 days. (e) NBT assay was performed at day 4 in SHC, shWIPI-1, shWIPI-2, shPI3KC3 and shBECN1 NB4 APL cells and NBT-positive cells were quantified from two independent experiments done in duplicate. (f) Relative transcript abundance for WIPI-1 and WIPI-2 was calculated as described in.12 M.W.U, *P<0.05. **P<0.01, ***P<0.001. M.W.U, Mann–Whitney U-test

