Figure 4.
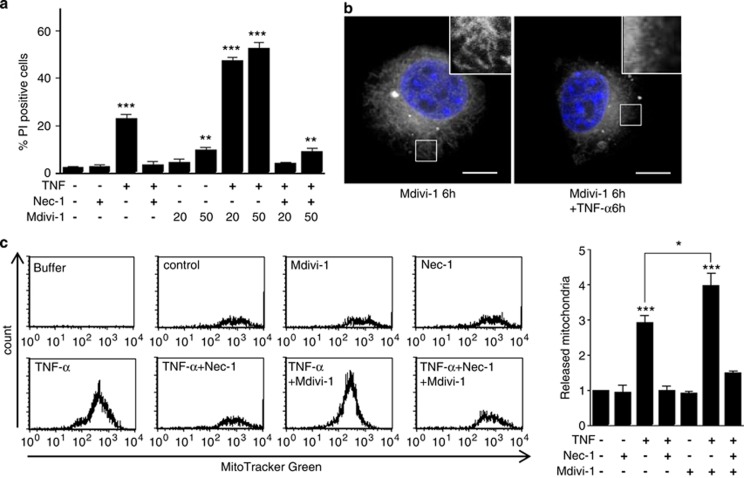
Mitochondrial fission and release during TNF-α-mediated necroptosis. (a) L929 cells were treated with the indicated doses of Mdivi-1 or 10 μM Nec-1 for 6 h and then treated with or without 5 ng/ml of TNF-α for 12 h. The cells were stained with propidium iodide and analyzed by flow cytometry. Data shown are mean values±S.E.M. of three independent experiments. (b) Fluorescence microscopic image of L929 cells pre-treated with 20 μM Mdivi-1 for 6 h and then treated or not with TNF-α for 6 h. Then, cells were stained with MitoTracker Deep Red and DAPI. Note the shortening of mitochondria (see inset for higher magnification). Scale bars: 10 μm. (c) The pellets were collected from the cell culture supernatant of L929 cells after 12 h incubation with TNF-α with/without pre-treatment with 20 μM Mdivi-1 for 6 h or in the presence of 10 μM Nec-1, and then stained with MitoTracker Green. The fluorescence-labeled pellets were analyzed by flow cytometry. The graphs depict the fold increase of MitoTracker-positive events compared with the control sample. Data shown are the mean values±S.E.M. of three independent experiments. *P<0.05, **P<0.01, ***P<0.001 by the Student's t-test

