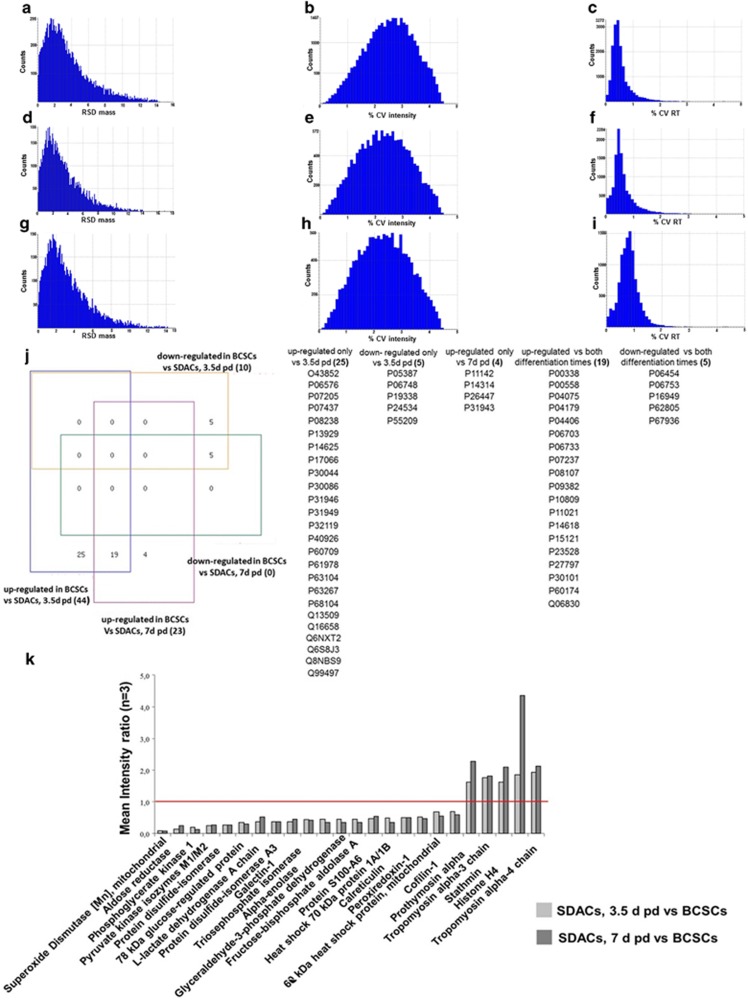
Figure 1.
Data quality evaluation, Venn analysis, and expression ratios for significantly regulated proteins in BCSCs compared with SDACs. Analytical reproducibility of mass spectra was assessed in BCSCs, and cells were allowed to differentiate as SDACs for 3.5 and 7 days. Bar charts show the mass relative standard deviation (RSD) and the intensity and retention time coefficients of variation (% CV) of exact mass retention time clusters detected in BCSCs (a, b, c), and SDACs collected at 3.5 days (d, e, f) and 7 days (g, h, i) post-differentiation (pd). (j) Four-way Venn diagram analysis of differentially expressed proteins identify 15 loci. Numbers in parentheses represent the total number of identified proteins clustered in each locus. BCSCs compared to SDACs 3.5 days pd show 25 and 5 proteins specifically up-regulated and down-regulated, respectively; BCSCs show 4 proteins up-regulated compared to SDACs 7 days pd; BCSCs show 19 and 5 proteins up-regulated and down-regulated, respectively compared to SDACs regardless of differentiation time. The Swiss-Prot accession numbers are listed in table (see the Supplementary Tables S1 and S2 for a detailed description). Analysis was performed using the four-way Venn Diagram Generator freely available at http://www.pangloss.com/seidel/Protocols/venn4.cgi. (k) Bar chart displays the mean protein expression level ratios (n=3) of 19 and 5 proteins up- and down-regulated, respectively in BCSCs compared to SDACs regardless of differentiation time . The red line indicates the expression ratio=1

