Figure 2.
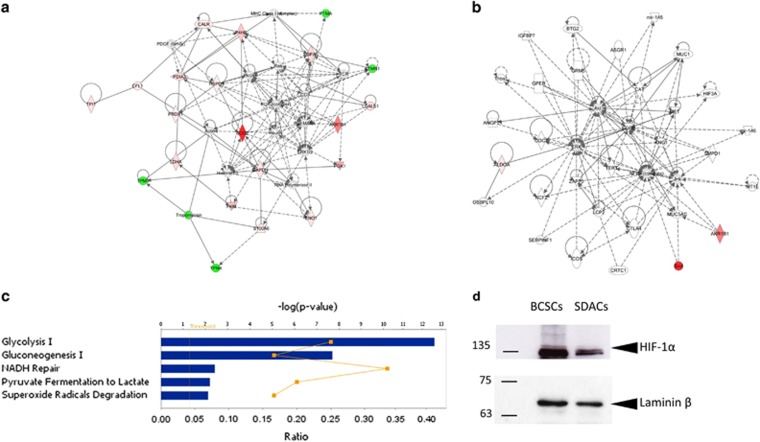
Functional and protein network analysis indicates increased glycolytic activity and activation of HIF-1α pathway in BCSCs. Ingenuity Pathway Analysis of differentially expressed proteins in BCSCs compared with SDACs result in two interaction network related to (a) the haematological, immunological, and inflammatory diseases and (b) the free radical scavenging and cancer pathway. Diagrams show focus genes (the differentially expressed proteins) that are depicted in green (downregulated) or red (upregulated). Solid and dashed lines indicate the direct and indirect interactions, respectively, and the arrows indicate the modulatory role of proteins or endogenous chemicals. (c) The canonical pathways associated with BCSCs are glycolysis, gluconeogenesis, and superoxide radical degradation. Functional pathway analysis was performed using the Ingenuity Pathway Analysis tool for the significantly regulated proteins in BCSCs compared with SDACs. The bar graph shows the scores (−log10P) associated to the pathways enriched with regulated proteins as determined using right-tailed Fisher's exact test with threshold <0.050. The yellow line indicates the ratio calculated as the number of proteins in a given pathway that meet the cutoff criteria (P=0.050) divided by the total number of molecules that make up that pathway. (d) BCSCs upregulate normoxic HIF-1α. Nuclear extracts were assessed for HIF-1α and laminin β by WB. WB shows that the HIF-1α expression level significantly decreases in cells allowed to differentiate as SDACs for 3.5 days

