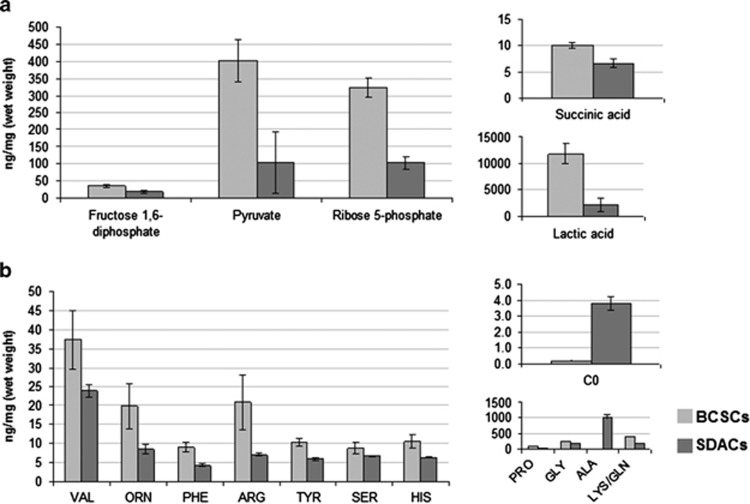
Figure 3.
Targeted metabolomics reveals significant alterations of glycolytic intermediates, glucose-derived non-essential amino acids, free carnitine, and AcCs, suggesting increased lactic fermentation and inhibition of FAoxidation in BCSCs. Bar graphs show the mean concentrations of (a) glycolytic and Krebs cycle intermediates and (b) amino acids and free carnitine in BCSCs and SDACs. Results of targeted metabolomic analysis are available in the Supplementary Table S5. The differences shown in the bar graphs are all significant (two-tailed t-test, P<0.050). Concentrations are expressed as ng/mg (wet weight). Bars show the mean value±S.D. (n=6)

