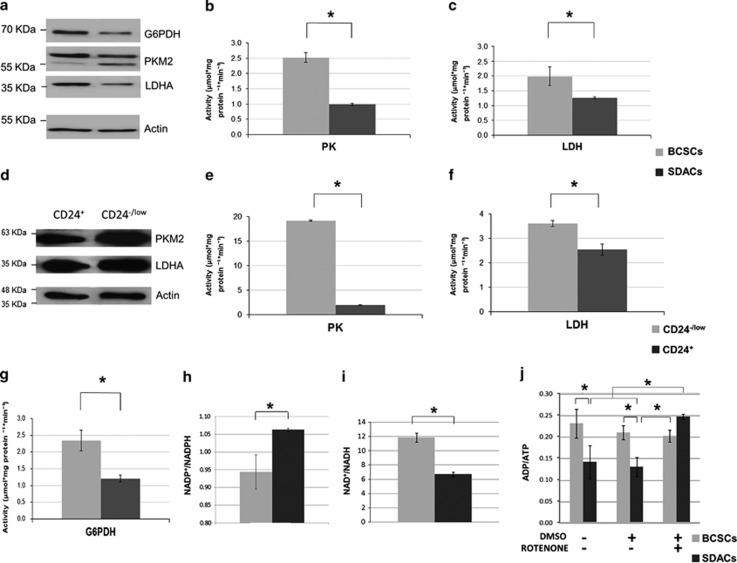
Figure 4.
The expression levels and activities of glycolytic enzymes are increased in BCSCs and correlate with altered energy and redox status of BCSCs. (a) WB showing PKM2, LDH-A, and G6PDH expression in BCSCs compared with SDACs. β-Actin is used as a protein-loading control. A representative WB of three independent experiments is shown. (b) PK and (c) LDH, and enzyme activities evaluated in spheres (BCSCs) as compared with differentiated cells (SDACs). Bar graphs show the mean activity (n=6) expressed as μmol/mgProtein/min, and bars represent the S.E.M. (d) WB showing the expression of PKM2 and LDH-A in cells sorted for CD24 expression. β-Actin is used as a loading control. (e) PK and (f) LDH activity in CD24−/low cells compared with CD24+ BCSCs. Bar graphs show the mean activity (n=6) expressed as μmol/mgProtein/min, and bars represent the S.E.M. (g) G6PDH enzyme activity evaluated in spheres (BCSCs) as compared with differentiated cells (SDACs). Bar graphs show the mean activity (n=6) expressed as μmol/mgProtein/min, and bars represent the S.E.M. (h) NADP+/NADPH, (i) NAD+/NADH, and (j) ADP/ATP ratios in BCSCs compared with SDACs. Treatment with rotenone does not affect ATP production in BCSCs, whereas strongly increases the ADP/ATP ratio and inhibits mitochondrial ATP production in SDACs. No changes in the ADP/ATP ratio are observed in BCSCs and SDACs after addition of dimethylsulphoxide (DMSO) alone used as a vehicle control. Bars show the mean value±S.D. (n=3). *P<0.050 (unpaired two-tailed t-test or two-factor ANOVA)

