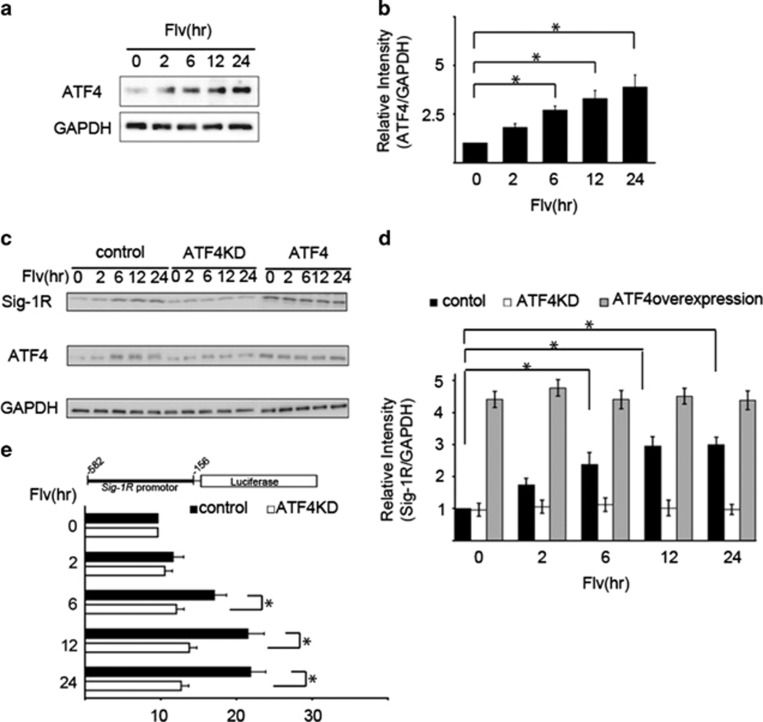
Figure 2.
Flv-induced Sig-1R expression is mediated by the transcription factor ATF4. (a) Flv (10 μg/ml) was added to Neuro2a cells, and the expression of ATF4 and GAPDH was measured over the time course shown. (b) The amount of ATF4 and GAPDH protein in (a) was quantified with densitometry. Relative intensity of ATF4/GAPDH increased significantly in response to Flv treatment. The 0 h time point was normalized to 1. Values are the mean±S.D. (*P<0.05, Student's t-test; n=3). (c) Flv (10 μg/ml) was added to HEK293 cells after ATF4 knockdown (ATF4KD), ATF4 overexpression (ATF4), or mock transfection (control). Sig-1R expression was monitored over the time course shown in the figure. In ATF4KD cells, an increase in Sig-1R protein expression was not observed even with Flv treatment. (d) The amount of Sig-1R protein from the samples in panel (c) was quantified with densitometry. Mock-transfected HEK293 cells (control), ATF4KD, and ATF4 HEK293 cells are indicated by black, white, and gray bars, respectively. The 0 h time point was normalized to 1. Values are the mean±S.D. (*P<0.05, Student's t-test; n=3). (e) The reporter assay system shown in the figure was constructed. The Sig-1R promoter region (-582 to -156) was fused to a firefly luciferase plasmid (pGL4.12[luc2CP]) and transfected into HEK293 cells. After 48 h, control cells (control), cells transfected with control shRNA plasmids, and cells transfected with the ATF4-shRNA-pSuper plasmid (ATF4KD) were treated with 10 μg/ml of Flv over the time course shown in the figure. Relative luciferase activities were measured. Sig-1R expression was not significantly induced by Flv treatment in ATF4 knockdown cells. Values are the mean±S.D. (*P<0.05, Student's t-test; n=3)

