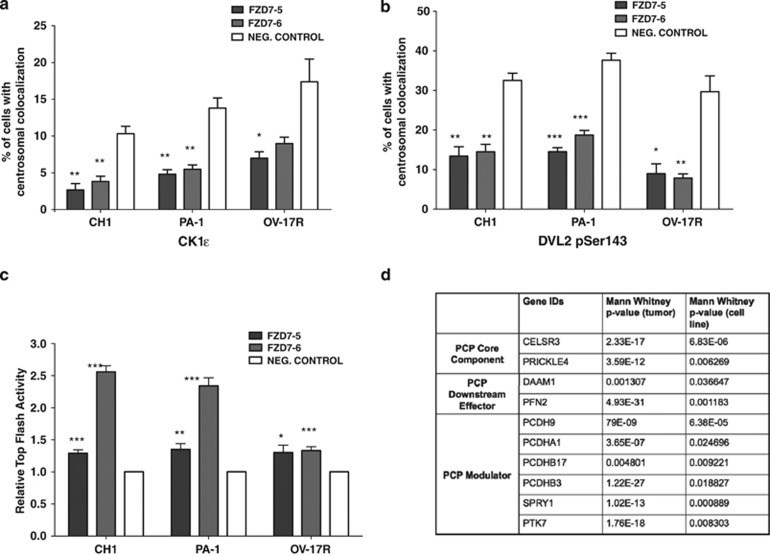
Figure 9.
Knockdown of FZD7 decreases the localisation of CK1ɛ and DVL2 pSer143 at the centrosome. Graphs represent the percentage of cells that have (a) CK1ɛ and (b) DVL2 pSer143 localisation at the centrosome after FZD7 downregulation. (c) Graph shows relative TOP FLASH activity after FZD7 knockdown. P-value *<0.05, **<0.01 and ***<0.001. (d) Table shows the OC microarray data analysis of Wnt/PCP pathway that are enriched in the Stem-A subtype

