Figure 3.
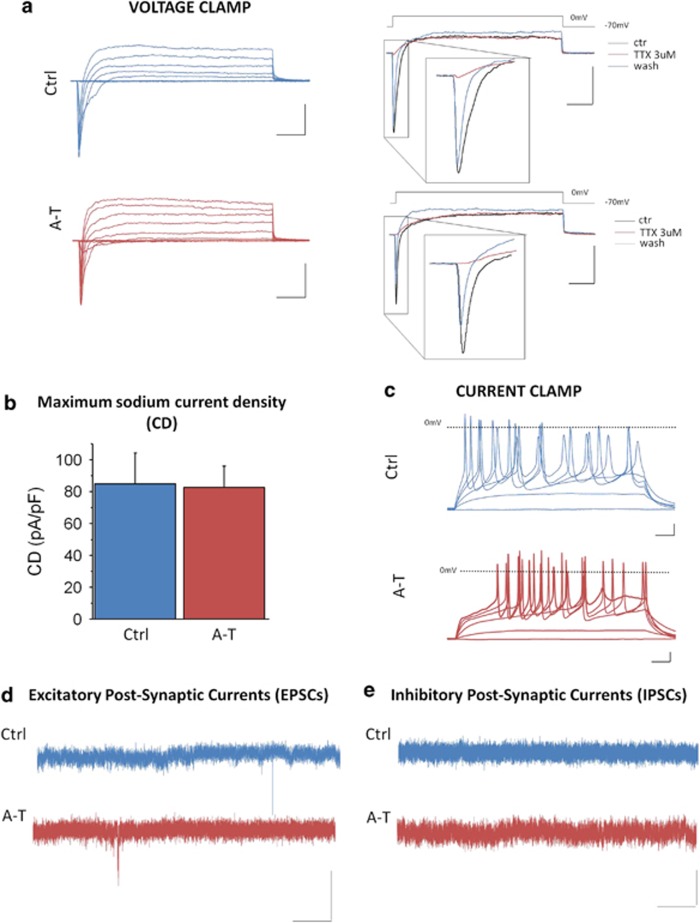
Functional characterization of Ctrl and A-T neurons after 50 days of differentiation. In a, left, patch clamp whole-cell recordings of representative total ionic currents elicited with depolarizing voltage steps between –70 and +10 mV (10 mV increments from a holding potential of –70 mV) in Ctrl and A-T hNP-derived neurons; scale bar: 500 pA, 10 ms. In a, right, representative currents elicited with a depolarizing voltage step to −10 mV in control (black), during perfusion with TTX 3 μM (red) and after washout (blue) in Ctrl (upper panels) and A-T (lower panels) hNP-derived neurons; scale bar: 500 pA, 10 ms. In b, bar graph of maximum sodium current densities (CD) in Ctrl and A-T hNPC-derived neurons (no statistical significant difference: unpaired T-test). In c, representative action potential discharges recorded in current clamp during injections of 1-s long depolarizing current steps from a holding potential of −70 mV; scale bar: 10 mV, 100 ms. In d, traces showing sEPSCs, recorded at the holding potential of −70 mV, while in e traces showing the absence of sIPSCs, recorded at the holding potential of +30 mV; scale bar: 10 mV, 1 s

