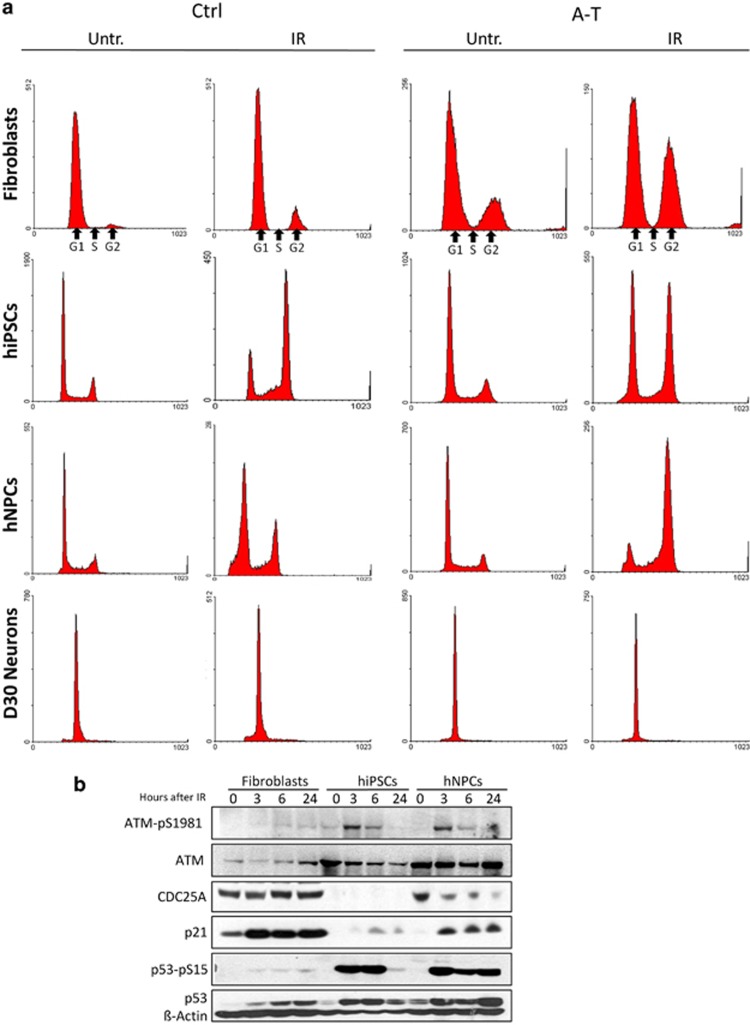
Figure 4.
Cell cycle phase distribution changes after IR treatment. Ctrl and A-T cells at various developmental stages (primary fibroblasts, hiPSCs, hNPCs, D30 post-mitotic neurons) were treated with 5 Gy IR, collected after 24 h, and analyzed for DNA content by flow cytometry (a). In b, Ctrl fibroblasts, hiPSCs and hNPCs were treated with 5 Gy IR, collected at the indicated times and analyzed by western blot. β-Actin was used as a loading control

