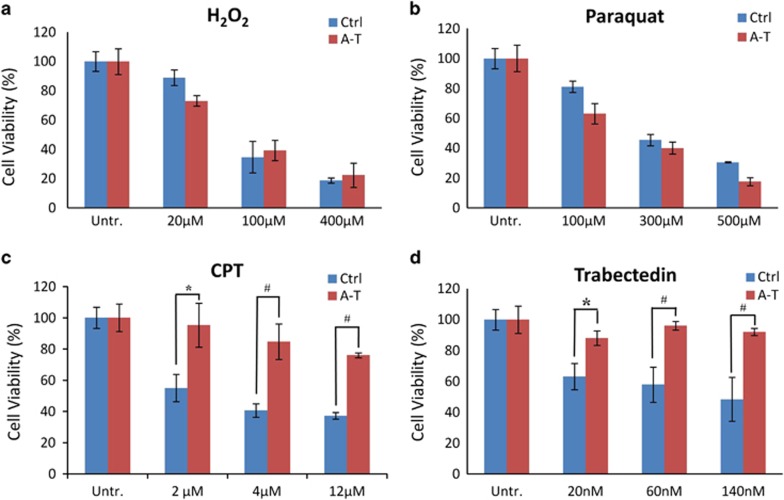
Figure 7.
A-T post-mitotic cells are resistant to CPT and trabectedin treatment. Neurons at D30 grown in 96-well plates were assessed for cell viability by CellTiter-Glo 72 h after exposure to H2O2 for 20 min (a), or continuously with Paraquat (b), CPT (c) and trabectedin (d) at the indicated doses. All treatments were performed in triplicate wells. The graphs show mean±S.D. and, where indicated, the difference between Ctrl and A-T was statistically significant (*P<0.05; #P<0.01) (analysis performed by the Student's t-test)

