Figure 8.
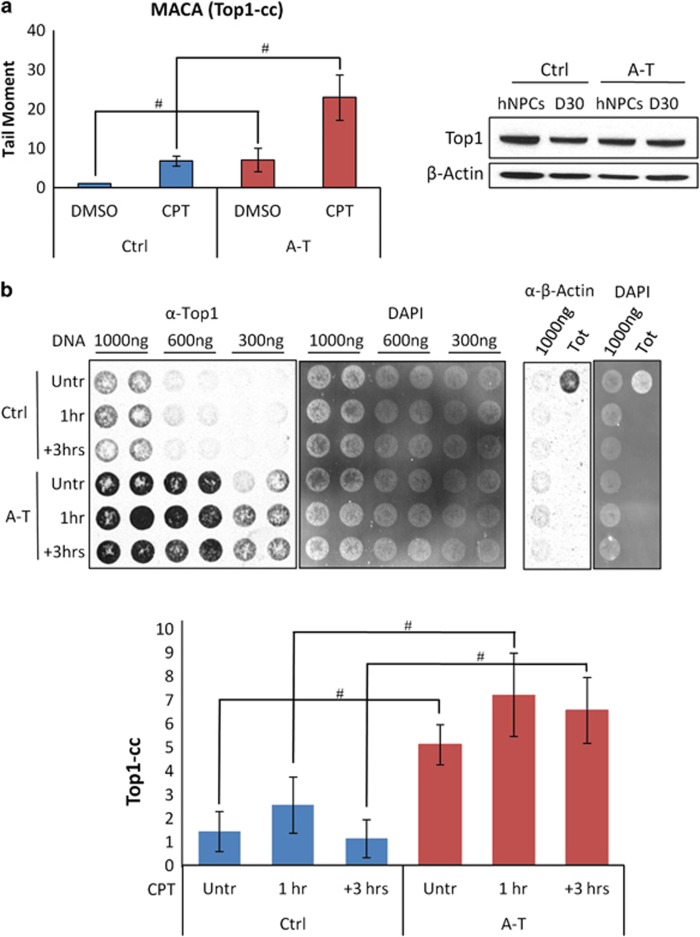
A-T post-mitotic neurons accumulate abnormal levels of Top1-cc. Total intracellular levels of Top1 protein were analyzed by western blot in proliferating hNPCs and post-mitotic neurons (a left). The levels of endogenous Top1-ccs were quantified in Ctrl and A-T post-mitotic neurons (D30) subjected to 30 μM CPT for 40 min by MACA from 50 cells per sample per experiment (a right). Data are the average of three independent experiments (mean±S.D.). For each time point, the difference between Ctrl and A-T was statistically significant (#P<0.01) except where indicated. In b, Ctrl or A-T post-mitotic neuronal cells were untreated or treated with 30 μM CPT for 60 min or incubated and harvested 3 h after washing. The DNA was purified from cells after lyses with a denaturing buffer (MB) as reported in Materials and methods section. The indicated amount of DNA was vacuum blotted on a nitrocellulose membrane, which was then tested with anti-Top1 antibody and ECL (left) and with DAPI (middle). β-Actin (left) represents the control for non-covalently bound contaminant proteins. The densitometry analysis of Top1-cc signals after normalization for blotted DNA (DAPI) from three biological replicates (mean±S.D.) is reported in the graph. Y axis represents the relative signal intensity. Where indicated the difference between Ctrl and A-T was statistically significant (#P<0.01; analysis performed by the Student's t-test)

