Figure 7.
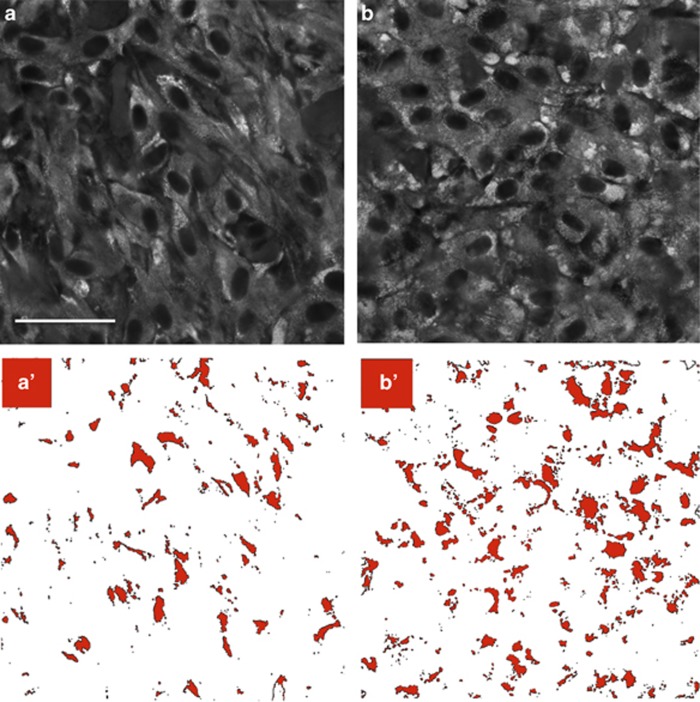
A2E increases glycogen stores. Fluorescence microscopy images of (a) control and (b) A2E-treated ARPE-19 cells fixed in methanol, oxidized with periodic acid, reacted with pararosaniline, and visualized via confocal fluorescence microscopy under identical acquisition conditions. Scale bar, 35 μm. Cells were cultured for 4 months on polycarbonate mesh and either treated weekly with liposomal A2E or liposomes alone (control). Glycogen is seen as areas of increased fluorescence intensity (lighter areas). Excitation=638 nm, emission=660–737 nm. Control and A2E-treated cells fixed in methanol alone, or reacted with pararosaniline, but not oxidized with periodic acid, were not fluorescent at these wavelengths Supplementary Figure S5. To quantify glycogen in panels a and b, the images were converted into binary images a′ and b′, respectively, where black represents fluorescence intensity or glycogen deposits above a defined threshold. Treated cells had a 110% increase in total area of fluorescence (64 358 control versus 133 219 treated) as well as 110% increase in fluorescence area fraction (6 versus 13)

