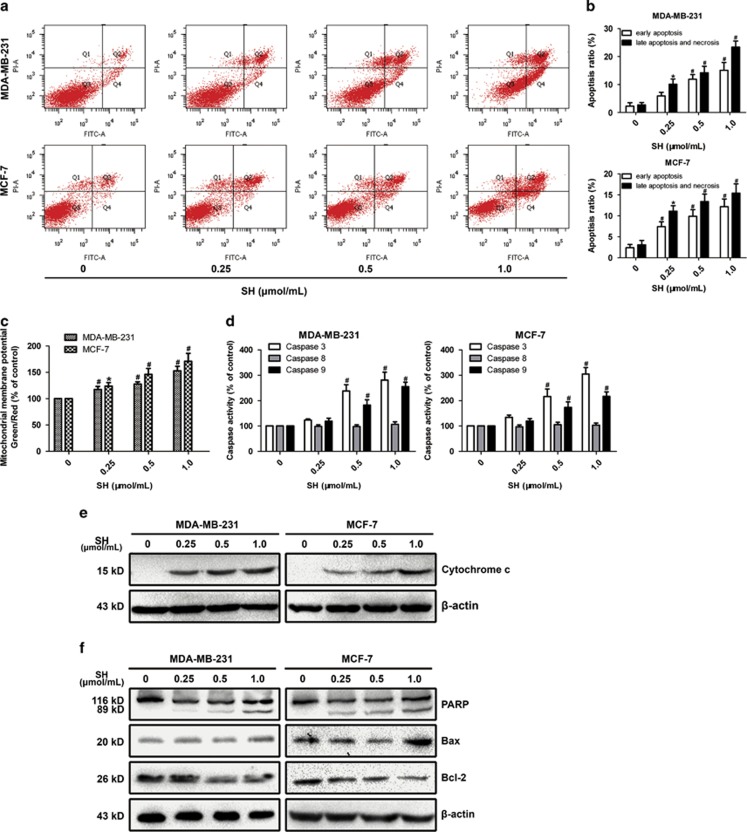
Figure 3.
SH induced apoptosis in human breast cancer cells. (a and b) Cells were treated with SH for 48 h and analyzed using AnnexinV-FITC/PI flow cytometry. (c) Δψm was evaluated by flow cytometric analysis of JC-1. Cells were treated with SH for 48 h and stained with JC-1. Green/red fluorescence intensity value was calculated. (d) Cells were treated with SH for 48 h and caspase-3, -8 and -9 were assessed by Caspase-3, -8 and -9 Colorimetric Assays. Each value is expressed as the ratio of caspase activation level to control level, and the value of the control was set to 100. (e) SH increased the release of cytochrome c from the mitochondria into the cytoplasm. Cells were treated with SH, and cytosolic fraction was used for western blotting. (f) Apoptosis-related proteins, PARP, Bax and Bcl-2, were analyzed by western blotting. Cells were treated with SH for 48 h, and total proteins were extracted. Equal protein loading was evaluated by β-actin. Data are the means±S.D. of three independent experiments. *P<0.05, #P<0.01, SH-treated group compared with the untreated control group

