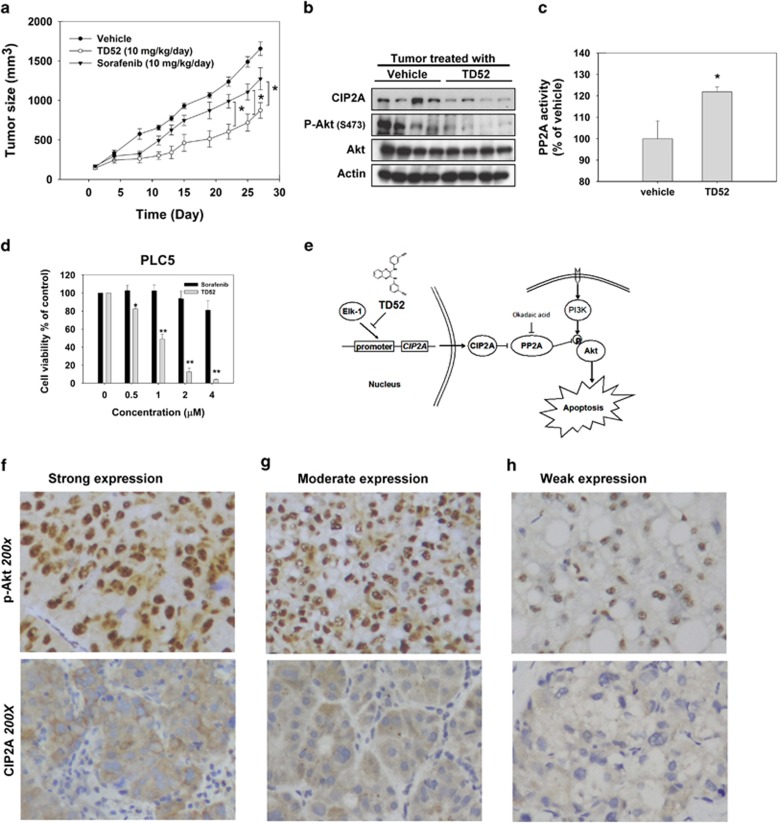
Figure 4.
Validation of the CIP2A/PP2A/p-Akt in clinical HCC samples and in vivo PLC5 nude mice model. (a) The growth curves of PLC5 xenograft tumor in TD52-, sorafenib- and vehicle- treated nude mice. * P<0.05; Points, mean; bars, S.D. (n=6). (b) The expression levels of CIP2A, P-Akt and Akt1 in PLC5 xenograft tumors were analyzed by western blot. (c) Analysis of PP2A activity of PLC5 xenograft tumor in TD52- and vehicle-treated nude mice. *P<0.05; Bar, mean; error bars, S.D. (n=3). (d) Dose-dependent effects of sorafenib and TD52 on cell viability in PLC5 cells. PLC5 cells were treated with sorafenib and TD52 at indicated concentration for 48 h and cell viability was determined by MTT assay. Bar, mean; error bars, S.D. (n=3). (e) Schema of the signaling pathways that explains pro-apoptotic effects of TD52 in HCC cells. (f–h) Expression analysis of CIP2A and p-Akt in clinical HCC tissues. Representative immunohistochemical patterns of strong (f, upper panel), moderate (g, upper panel) and weak (h, upper panel) p-Akt nuclear expression in HCC tissues. Although the representative immunohistochemical patterns of CIP2A of strong (f, lower panel), moderate (g, lower panel) and weak (h, lower panel) cytoplasmic expression in cancer tissues. (Magnification, × 200)

