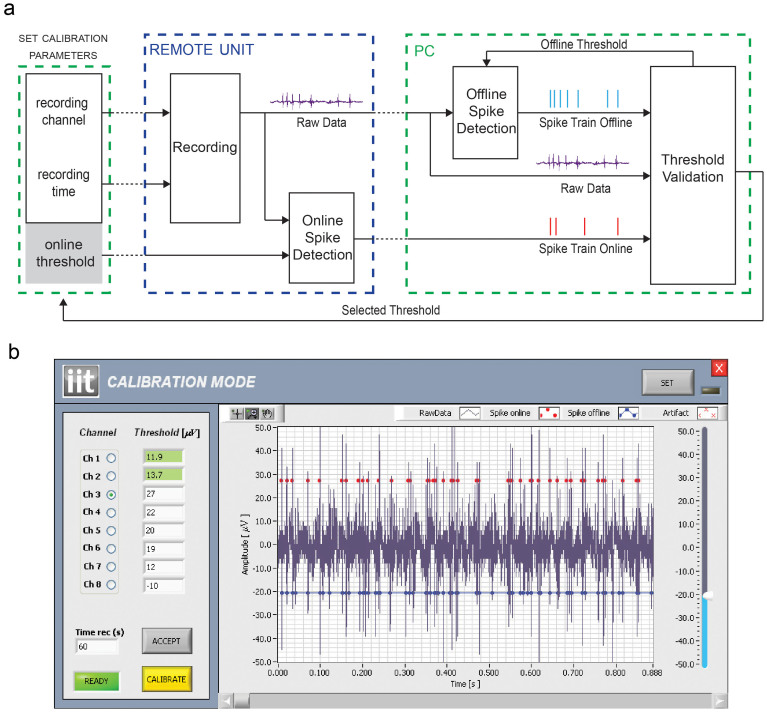
Figure 3.
(a) Schematic representation of the steps required by the calibration procedure. Black arrows represent wired data transfers whereas dotted lines depict wireless communications. (b) A screenshot of the calibration mode GUI made by a control panel (left side) and a graph window (right side). The user can select the channel to be used for the calibration procedure, the threshold for the online spike detection and the time duration of the recording. The procedure starts by pressing the Calibrate button and, after the selected time, the graph window is updated. The blue trace represents the recorded raw data, the red dots the spikes detected by the online algorithm running on the RU, while blue dots are used to plot the spike occurrences resulting from the offline algorithm running on the PC. Every time the offline threshold is changed by the user through the slider placed on the right side of the graph window, the system updates the related detected spikes. Once a good threshold has been found, the user can save it on the RU to be used during the multichannel recording mode by pressing the button ACCEPT. The saved thresholds are represented in green in the control panel.

