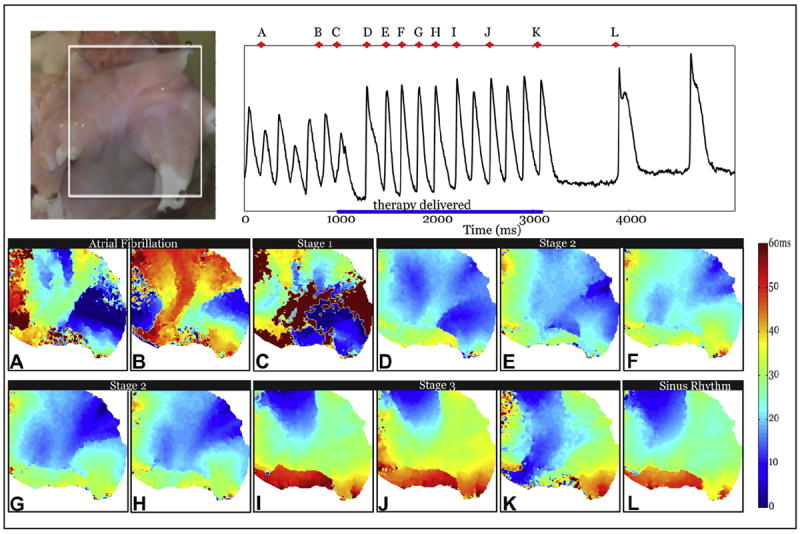
Figure 4. Optical Mapping of Successful Termination of AF by MSE.

The white box in the top left panel shows the field of view. Activation maps during a representative successful application of MSE with a peak voltage of 7 V/cm. (A and B) AF (C) Stage 1 shocks. (D to H) Stage 2 shocks. (I to K) select Stage 3 pulses. (L) Restored sinus rhythm. Abbreviations as in Figure 2.
