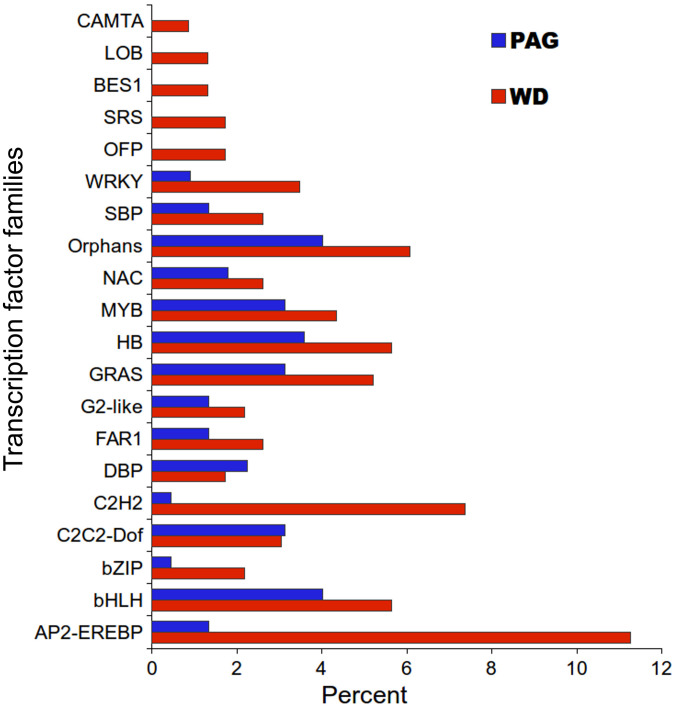
Figure 2. Relative abundance and distribution of top 20 transcription factor (TF) families during the period of active growth (PAG) and winter dormancy (WD) for unigenes exhibiting significant differential expression.
“Percent” on X-axis represents percent TF families out of total differentially expressed TF families in the tea transcriptome. Supplementary Table S2 has details on all the TF families up-regulated during PAG and WD. Full name of various TF families are expanded in Supplementary Table S6.

