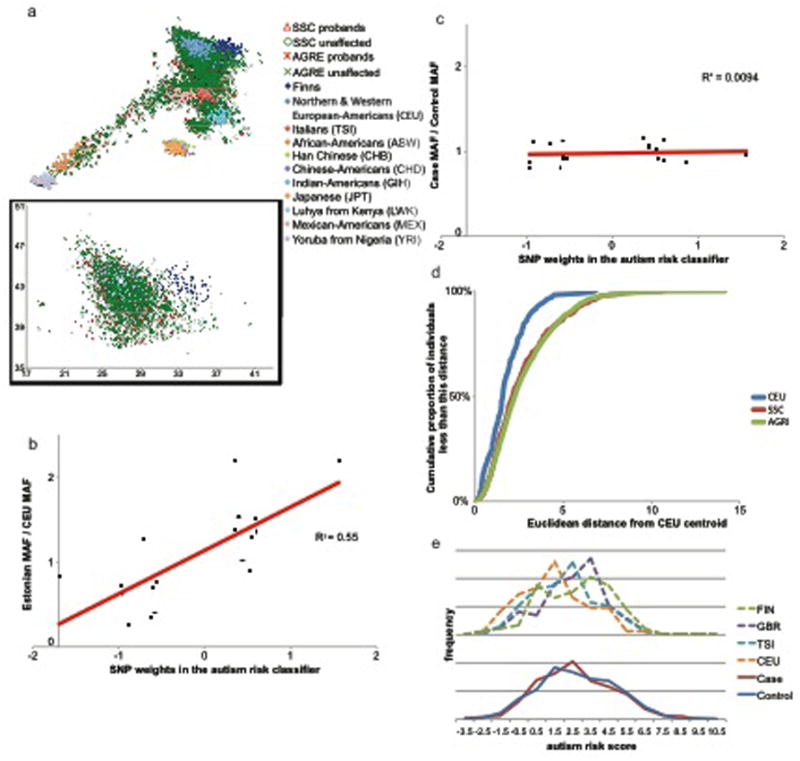
Figure 1. The most predictive SNPs in the classifier are correlated with ancestry within Europe, but not with autism.

(a) The cases and controls used for training and validation were drawn from different European population distributions, in a manner consistent with the differences in minor allele frequencies of the top SNPs in the classifier. Plotted on rotated and inverted geographic axes of European variation (Yang et al. 2012) are individuals from the control population CEU (light blue diamonds representing Northern and Western European-Americans), and individuals with and without autism from the training and replication case datasets (AGRE probands as red asterisks and unaffected relatives as green Xs; SSC probands as red triangles and unaffected relatives as green circles). The eleven HapMap3 populations and a reference Northeastern European population (Finns from the 1000 Genomes Project) are denoted by diamonds. To reduce population stratification bias, Skafidas and colleagues only used individuals nearer CEU than any other HapMap population to train the classifier. However, we highlight considerable differences in population structure between cases and controls even in this subset (represented in the inset box, the red cross indicates the centroid of CEU). (b) The weights of the top reported SNPs (x-axis) are correlated with the minor allele frequency in Estonians (a Northeastern European population) divided by that of CEU (y-axis) (p= 4×10⁻⁴). While 1000 Genomes data were not available for Estonians, the Estonian minor allele frequencies are based on considerably more chromosomes, allowing for more accuracy. (c) In contrast, the weights of the top reported SNPs (x-axis) are uncorrelated with the odds ratios among an independent set of individuals in AGRE nearest CEU (p = 0.997). (d) The case sets are more diverse than the control sets (p=6.2×10⁻⁵ for CEU vs AGRE or p=4.6×10⁻⁸ for CEU vs SSC, two-sided Kolmogorov-Smirnov test). Cumulative proportion of AGRE, SSC and CEU individuals plotted against Euclidean distance from the CEU centroid, for those individuals nearer the CEU centroid than that of any other HapMap population in the inset of panel a. (e) Frequency distributions of autism risk scores for the independent set of AGRE cases and controls and four populations sequenced in the 1000 Genomes Project (FIN – Finns, GBR – British, TSI – Italians, and CEU – Northwestern Europeans).All classifier scores were calculated using the 19 SNPs that had data in all of these sets and were also in the top 30 most discriminative SNPs in Skafidas et al (2012). Neither the distributions of cases and controls, nor the proportion above the threshold level differ significantly from one another. In contrast, different populations have different distributions. Finns differ from neither independent AGRE cases nor independent AGRE controls, while other European populations have lower scores.
