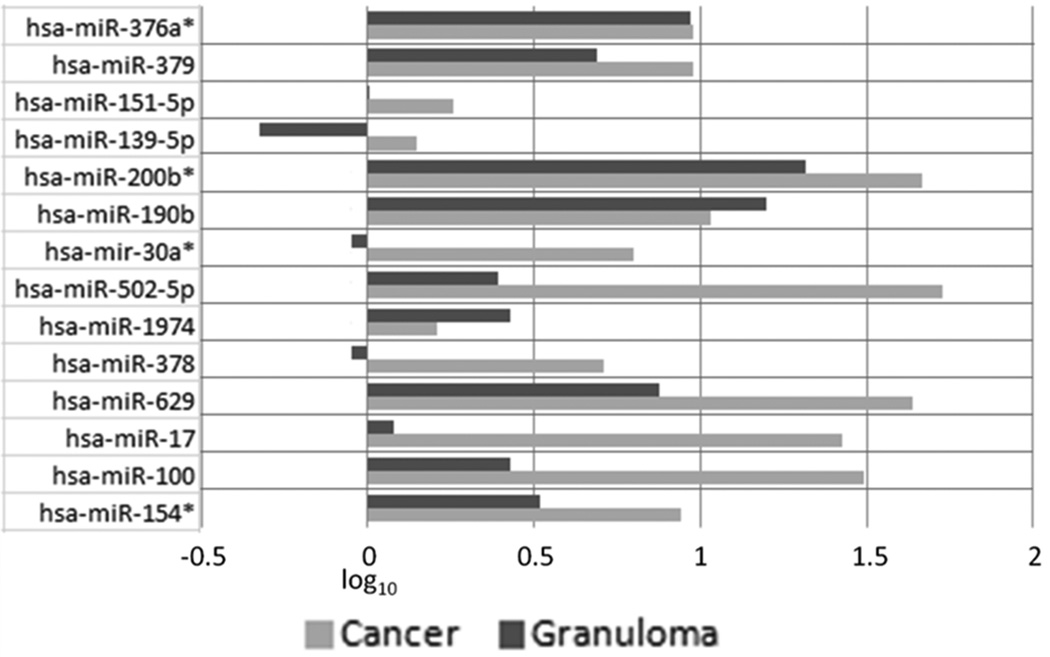
Figure 2. MicroRNAs expression levels overview.

After data set normalization, the log10 of 2(-ΔΔCt) was taken each microRNAs. The graph show expression levels value of each microRNAs, one for Lung Adenocarcinomas from Healthy Controls (reported as “Cancer” bars in the graph) and another for Lung Granulomas from Healthy Controls (reported as “Granuloma” bars in the graph). Concerning Lung Granulomas expression levels, 3 to 14 microRNAs showed slightly downregulation, 10 microRNAs were found upregulated. MiR-151a-5p has shown no expression levels compared to normal donors.
All 14 microRNAs resulted upregulated in Lung Adenocarcinomas expression levels.
