
Figure 3. Screening model ROC curve.
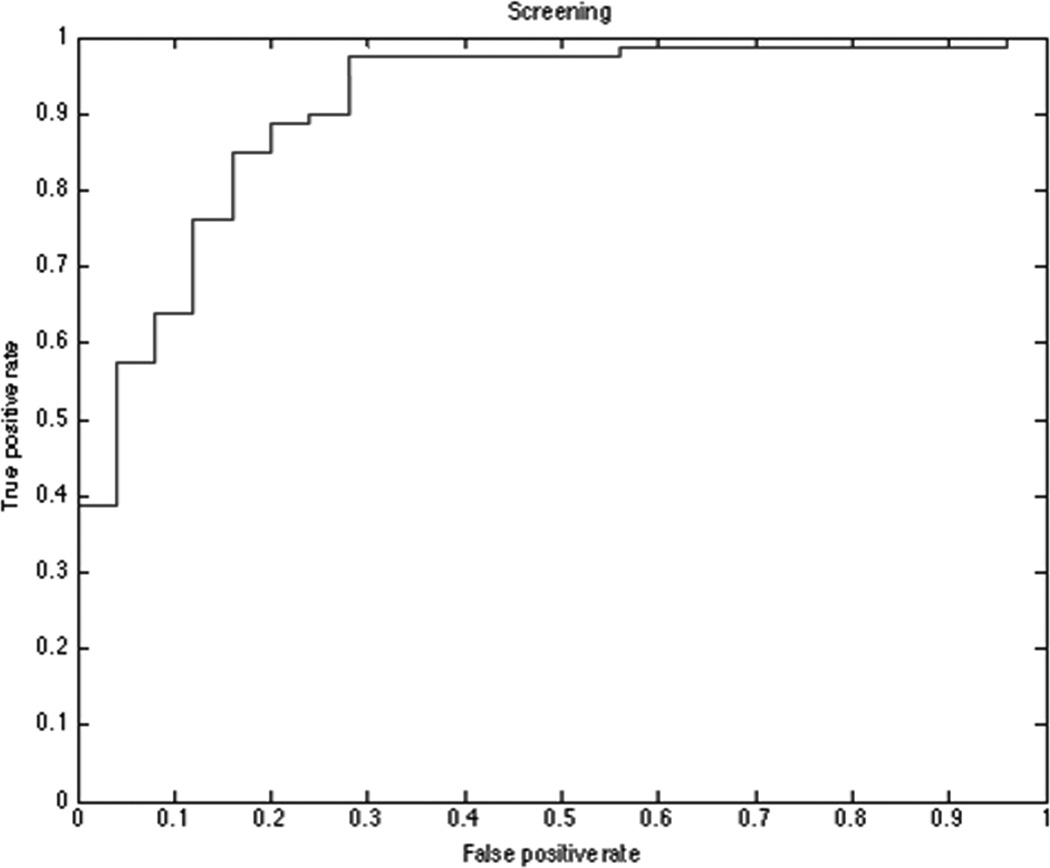
Receiver operating characteristic (ROC) plot for screening model microRNAs set. Screening model distinguish between control subjects and patients with any kind of nodules (Lung Adenocarcinomas and Granulomas) with an AUC = 0.908 (p<0.001).