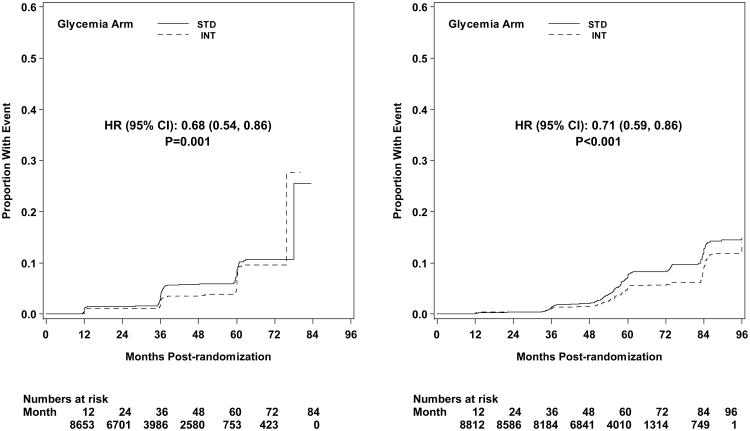
Figure A3.
Kaplan-Meier curves for microvascular outcome Neph-2 (development of macroalbuminuria) by glycemia arm. Panel A: data until transition of intensive glycemia arm to standard therapy. Panel B: all data through end of study. Hazard ratios adjusted for baseline history of clinical cardiovascular disease and second trial treatment arm assignment.

