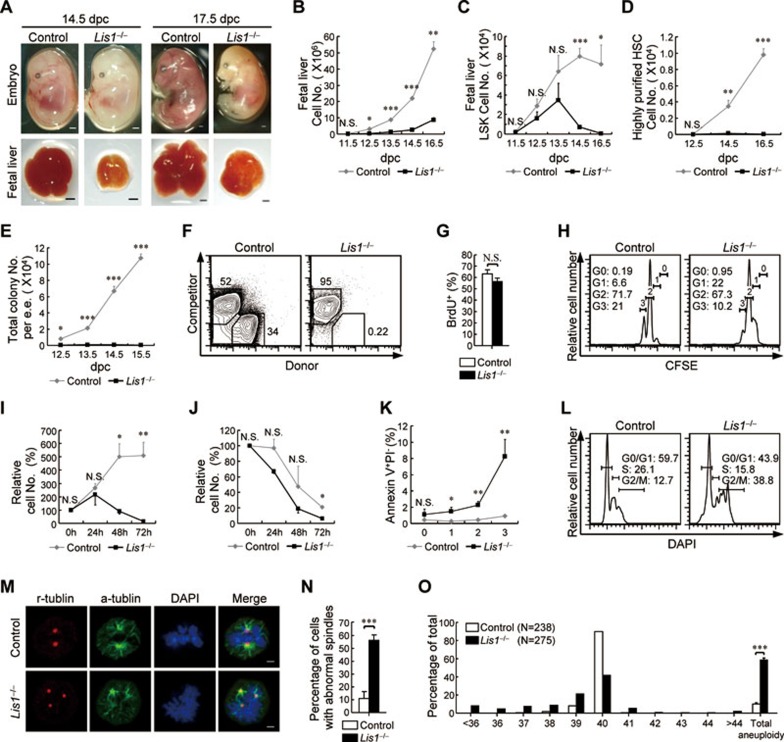
Figure 1.
Lis1 is required for the expansion of FL-HSCs. (A) Representative images of embryos (top) and fetal livers (bottom) from control and Lis1−/− mice at 14.5 dpc (left) and 17.5 dpc (right). Scale bar, 1 mm. (B) Absolute cell number of fetal livers from control littermates and Lis1−/− mice at different gestational ages (n = 2-8 for each genotype for each gestational age). (C, D) Absolute cell number of LSKs (C) and highly purified HSCs (D) from control and Lis1-deficient fetal liver cells at different gestational ages (n = 2-8 for each genotype for each gestational age). (E) Number of colonies generated from control and Lis1-deficient fetal livers in CFU assays (n = 2-3 for each gestational age, data are represented as number per embryo equivalent). (F) Flow cytometry analysis of donor chimerism in recipients transplanted with 1 000 sorted LSKs from control or Lis1-deficient 12.5 dpc fetal livers (n = 7 for control LSKs and n = 6 for Lis1-deficient LSKs from 3 independent experiments; data were obtained by analyzing the peripheral blood mononuclear cells from each recipient at week 4 post-transplantation). (G) Percentage of the LSKs entering S phase in control and Lis1-deficient 12.5 dpc fetal livers (n = 3 for control littermates, n = 4 for Lis1−/− mice). (H) Representative CFSE staining profiles of sorted CFSE+ LSKs cultured for 20 h (n = 5). (I, J) Relative survival rates of the LSKs from control or Lis1-deficient 12.5 dpc embryos cultured with (I) or without (J) SCF stimulation for the indicated periods of time. Relative survival rate was calculated as the ratio of surviving cells (Annexin V−, PI−) relative to the onset of the culture (n = 3 for stimulated samples and n = 2 for unstimulated samples). (K) Percentage of CFSE+ LSKs undergoing apoptosis (Annexin V+ PI−) after 10 h (for generations 0 and 1) or 20 h (for generations 2 and 3) culture (n = 5). (L) Representative histograms showing the cell cycle profiles of control and Lis1-deficient LSKs at 12.5 dpc (n = 3). (M) Representative metaphase images of control and Lis1-deficient LSKs that exhibited multipolar mitotic spindles. α-tubulin (green) marks mitotic spindles, γ-tubulin (red) marks centrosomes, and DAPI (blue) marks chromosomes (n = 4). Scale bar, 2 μm. (N) Frequency of control and Lis1-deficient LSKs that exhibited multipolar mitotic spindles (n = 56 for control LSKs and n = 60 for Lis1-deficient LSKs from 4 independent experiments). (O) Percentages of the LSKs that contained the indicated number of chromosomes as well as the total aneuploidy (data were obtained from 5 independent experiments). The data are mean ± SEM. For all panels: N.S., no significance. *P < 0.05, **P < 0.001, ***P < 0.0001 by Student's t-test.

