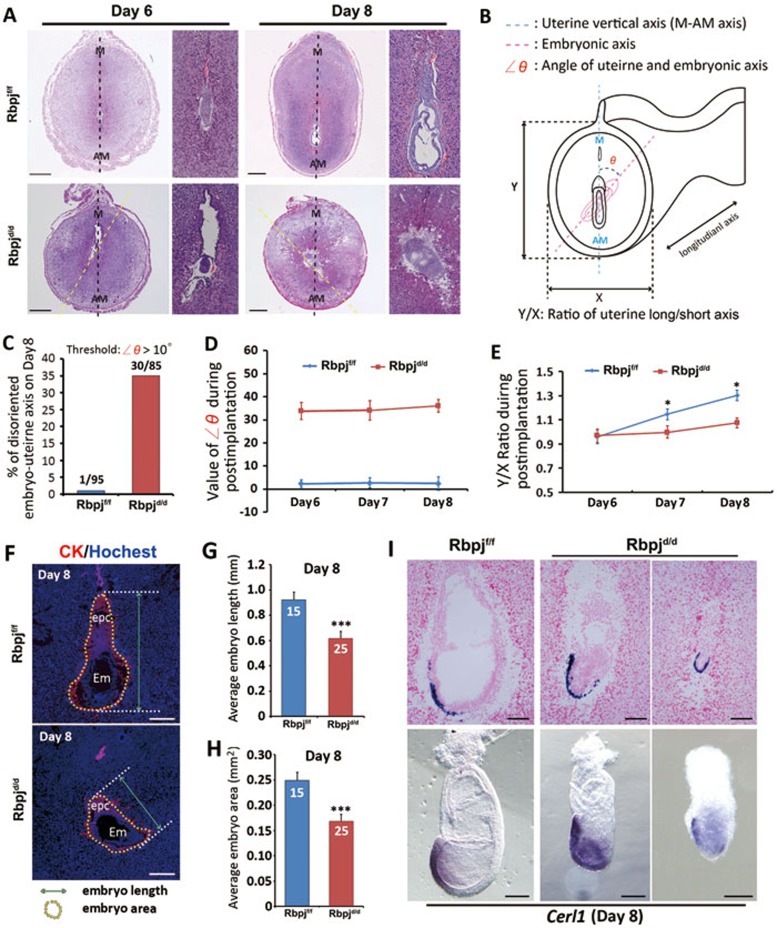
Figure 2.
Aberrant embryonic-uterine orientation and decidual patterning in Rbpjd/d females. (A) Representative cross-sections of Rbpjf/f and Rbpjd/d implantation sites on days 6 and 8. The narrow columns show a magnified embryonic image of the left pictures. The black dashed line shows the uterine long axis, and the yellow dashed line shows the embryonic long axis. AM, antimesometrial pole; M, mesometrial pole. Scale bar, 500 μm. (B) Schematic diagram illustrating the embryonic orientation within the uterus and the relative position of the section plane. The embryonic axis is parallel to the uterine M-AM axis in the Rbpjf/f uteri, while the embryonic axis (delineated by the red dashed line) is deflected from the uterine axis in the Rbpjd/d uteri. The angles of deviation are indicated as ∠θ. (C) The percentage of uterine-embryo disorientation on day 8 for Rbpjf/f and Rbpjd/d implantation sites. The threshold of ∠θ analyzed is > 10°. (D) The value of ∠θ during post-implantation stages in Rbpjf/f and Rbpjd/d implantation sites. n = 80-90 implantation sites for each time point. (E) The ratio of the uterine short (X) and long (Y) axes during days 6-8 in the Rbpjf/f and Rbpjd/d implantation sites, n= 80-90 implantation sites for each time point. Data shown represent the mean ± SEM. *P < 0.05. (F) Illustration for measurements of embryo length and embryo area (including ectoplacental cone (epc)) in Rbpjf/f and Rbpjd/d implantation sites. (G, H) Average embryo length (G) and embryo area (H) in Rbpjf/f and Rbpjd/d implantation sites. Data shown represent the mean ± SEM. ***P < 0.01. (I) In situ hybridization of Cerl1 in day 8 implantation sites and embryos isolated from Rbpjf/f and Rbpjd/d mice.

