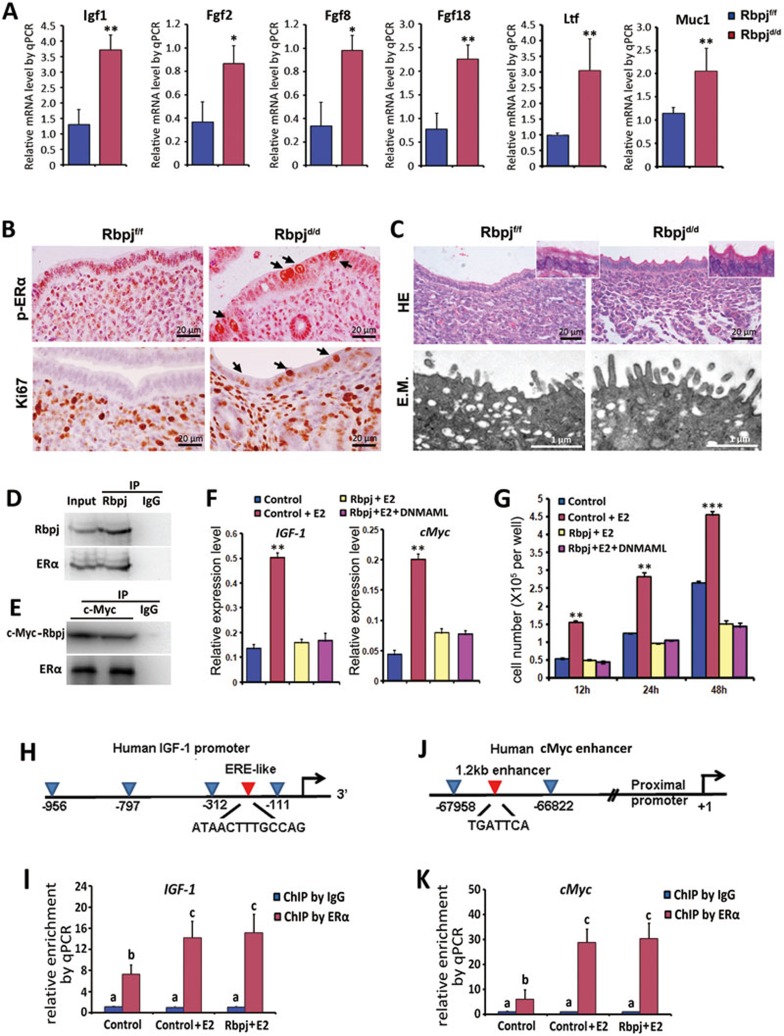
Figure 4.
Rbpj suppresses the estrogenic response by physically interacting with ERα in a Notch pathway-independent manner. (A) Relative expression levels of estrogen-regulated genes in Rbpjf/f and Rbpjd/d mice on day 4 of pregnancy. The values are normalized to the GAPDH expression level and indicated as the mean ± SEM. n = 3. *P < 0.05, **P < 0.01. (B) Immunohistochemistry of Ki67 and p-ERα in Rbpjf/f and Rbpjd/d uteri on day 4 of pregnancy. The black arrows indicate positive signals in the uterine epithelium. (C) HE staining and electron microscopy analysis of the uterine epithelial surface of day 4 uteri. E.M., electron microscopy. (D, E) Immunoprecipitation assays for detecting the interaction of Rbpj and ER. In D, day 4 uterine tissue lysates were subjected to immunoprecipitation using an anti-Rbpj antibody or goat IgG, followed by immunoblotting with anti-Rbpj and anti-ERα antibodies. In E, Ishikawa cell lysates (after transfection with c-Myc-tagged Rbpj vectors) were subjected to immunoprecipitation using an anti-c-Myc antibody or goat IgG, followed by immunoblotting with anti-c-Myc and anti-ERα antibodies. (F) E2-regulated genes IGF1 and cMyc were measured by quantitative RT-PCR for transfected Ishikawa cells. Results are normalized to the level of GAPDH and indicated as the mean ± SEM. n = 3. **P < 0.01. (G) Measurements of cell proliferation by MTS assay after 12 h, 24 h, and 48 h transfection. The values represent the mean ± SEM of six replicates from three independent experiments. **P < 0.01, ***P < 0.01. (H, I) Schematic representation of promoter region for IGF1 with ERE site indicated by a red arrowhead (H); ChIP-qPCR result showed enriched binding of ERα to the ERE site (I). (J, K) Schematic representation of promoter region for cMyc with ERE site indicated by a red arrowhead (J); ChIP-qPCR result showed enriched binding of ERα to the ERE site (K). In I and K, different letters represent statistical significance (a vs b and a vs c: P < 0.01; b vs c: P < 0.05).

