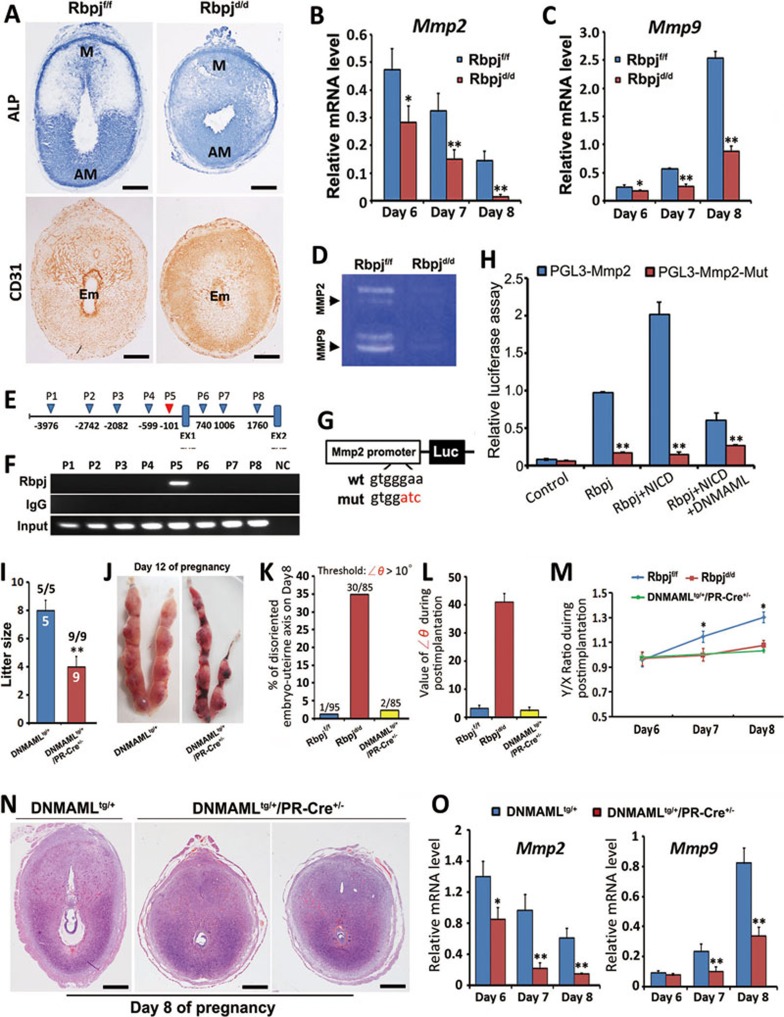
Figure 5.
Uterine deletion of Rbpj affects uterine decidual patterning by directly regulating Mmp2 in a Notch pathway-dependent manner. (A) ALP staining and CD31 immunohistochemistry of day 8 implantation sites in Rbpjf/f and Rbpjd/d mice. Note the diffused staining without clear polarization in the Rbpjd/d uteri, and disorganized vasculature compared with Rbpjf/f uteri. Scale bar, 500 μm. (B, C) Quantitative RT-PCR analysis revealed the decreased expression levels of Mmp2 (B) and Mmp9 (C) mRNAs in Rbpjf/f and Rbpjd/d implantation sites on days 6-8 of pregnancy. The values are normalized to the GAPDH expression level and are indicated as the mean ± SEM. n = 3. *P < 0.05, **P < 0.01. (D) Representative zymographic analysis of MMP activities from Rbpjf/f and Rbpjd/d day 8 implantation sites. Similar results were obtained in three independent experiments. (E) Schematic representation of the genomic structure of Mmp2. The triangles indicate potential Rbpj-binding elements within a region spanning 5 kb upstream of transcription starting site and intron-1. EX, Exon. (F) ChIP assay showing enriched binding of Rbpj to the Mmp2 promoter region. The locations of eight primer sets (P1 to P8) were designed to detect the Rbpj-binding sites. The P5 region, which is highlighted in red in E, represents an enriched binding region for Rbpj in the Mmp2 gene. (G) Schematic representation of the luc-Mmp2 and luc-Mmp2-mut reporter constructs for the enhancer assays. (H) Cis-activation potential of the region containing P5 or its mutant evaluated by luciferase assays. The values are shown as the mean ± SEM. **P < 0.01. n = 3. (I) Average litter sizes in DNMAMLtg/+ and DNMAMLtg/+/PR-Cre+/− mice. **P < 0.01. Numbers above bars represent number of mice gave birth/number of plugged mice. (J) Representative uteri from DNMAMLtg/+ and DNMAMLtg/+/PR-Cre+/− mice on pregnant day 12. (K) The percentage of uterine-embryo disorientation in day 8 implantation sites. The threshold of ∠θ analyzed is > 10°. (L) The value of ∠θ during post-implantation stages examined in day 8 implantation sites. n = 80-90 implantation sites for each time point. (M) The ratio of the uterine short (X) and long (Y) axes in days 6-8 implantation sites, n= 80-90 implantation sites for each time point. Data shown represent the mean ± SEM. *P < 0.05. (N) Representative cross-sections of DNMAMLtg/+ and DNMAMLtg/+/PR-Cre+/− implantation sites on day 8. Note the shortened Y axis in DNMAMLtg/+/PR-Cre+/− mice. Scale bar, 500 μm. (O) Quantitative RT-PCR analysis revealed the decreased expression levels of Mmp2 and Mmp9 mRNAs in the DNMAMLtg/+ and DNMAMLtg/+/PR-Cre+/− implantation sites on days 6-8 of pregnancy. Data shown represent the mean ± SEM. n = 3. *P < 0.05, **P < 0.01.

