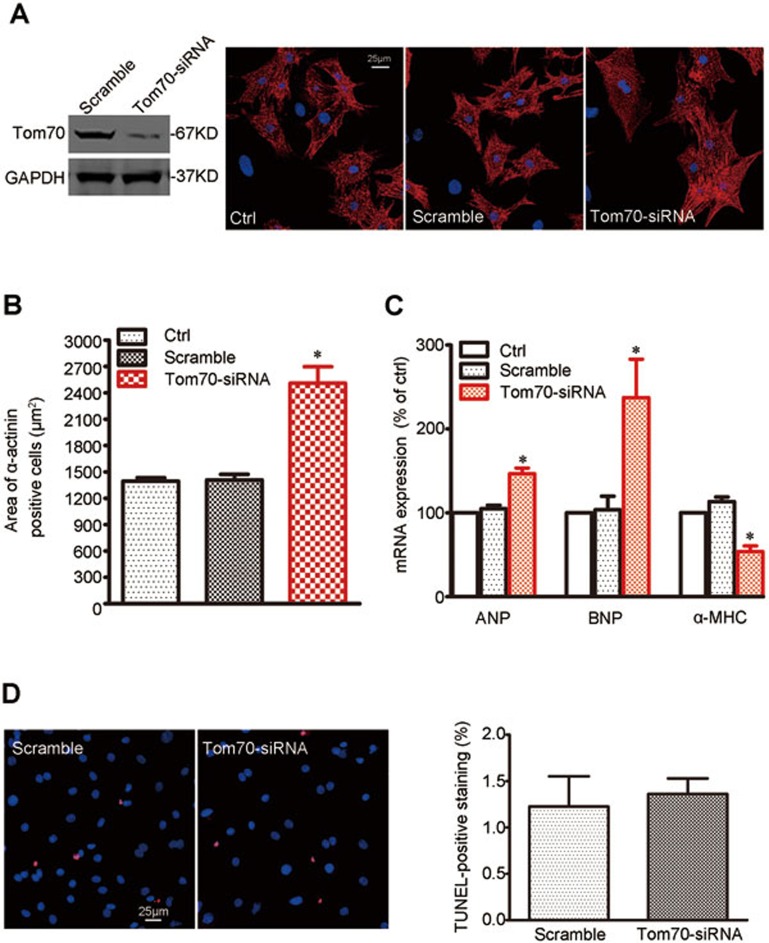
Figure 3.
Reduction in Tom70 in primary cardiomyocytes results in hypertrophic growth. Primary NRVMs were infected with Tom70 siRNA-expressing adenovirus and compared with the corresponding controls. All the experiments were performed 48 h after transfection. (A) Immunohistochemistry against α-actinin and DAPI was followed by cell area quantifications, as described in the Materials and Methods. At least 100 cells were quantified in all the groups. (B) Pooled data from A. (C) mRNA expression of pathological hypertrophic markers. Atrial natriuretic peptide, ANP; brain natriuretic peptide, BNP; alpha-myosin heavy chain, α-MHC. (D) TUNEL staining assay for cell viability. Left, typical images for the TUNEL-staining cardiomyocytes. Right, pooled data. All the data represent the means ± SEM. *P < 0.05 versus control as determined using one-way ANOVA.

