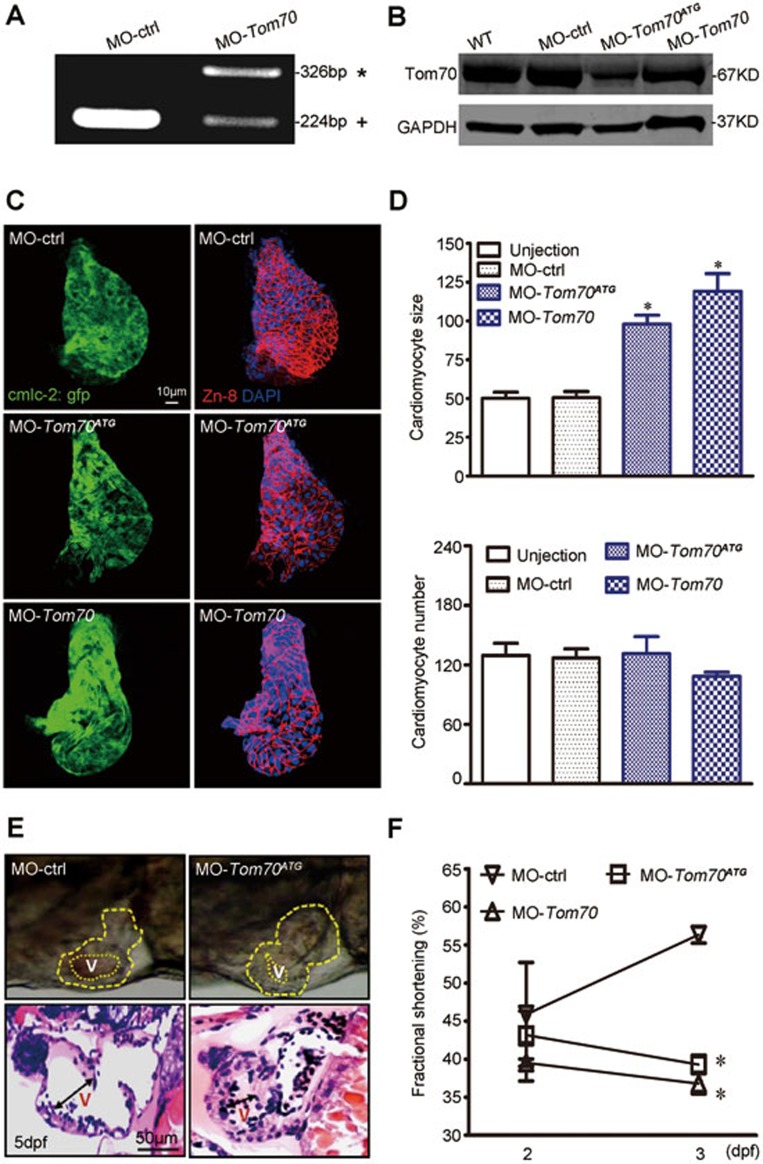
Figure 4.
Inactivation of Tom70 leads to pathological cardiac hypertrophy in zebrafish. (A) RT-PCR amplification of RNA from MO-ctrl- and MO-Tom70-injected zebrafish showing altered splicing of Tom70 with either the integration of intron 1(*) or the partial skipping of exon 1 (+). (B) Western blot analysis of MO-ctrl-, MO-Tom70- and MO-Tom70ATG-injected embryos at 2 dpf. GAPDH was used as a loading control. The data are representative of three independent experiments. (C) Dissection of beating hearts at 2 dpf followed by integrin staining (blue = DAPI, green = GFP and red = Zn-8). (D) Quantification of cardiomyocyte size and number from a total of 10 hearts per group in C. (E) Top, lateral close-up view of zebrafish hearts at 5 dpf. MO-Tom70ATG-injected embryos with hypertrophic hearts (yellow dotted line) were compared with control (MO-ctrl)-injected zebrafish. Bottom, H&E staining of zebrafish heart sections of MO-ctrl- and MO-Tom70ATG-injected embryos. The ventricular (v) chambers of MO-Tom70ATG-injected zebrafish are constricted. n = 10 embryos. (F) Quantification of ventricular fractional shortening (FS) in MO-Tom70ATG-injected zebrafish embryos at the indicated stages. The data represent the means ± SEM. n = 10 embryos per time point. *P < 0.05 versus the respective control using one-way ANOVA.

