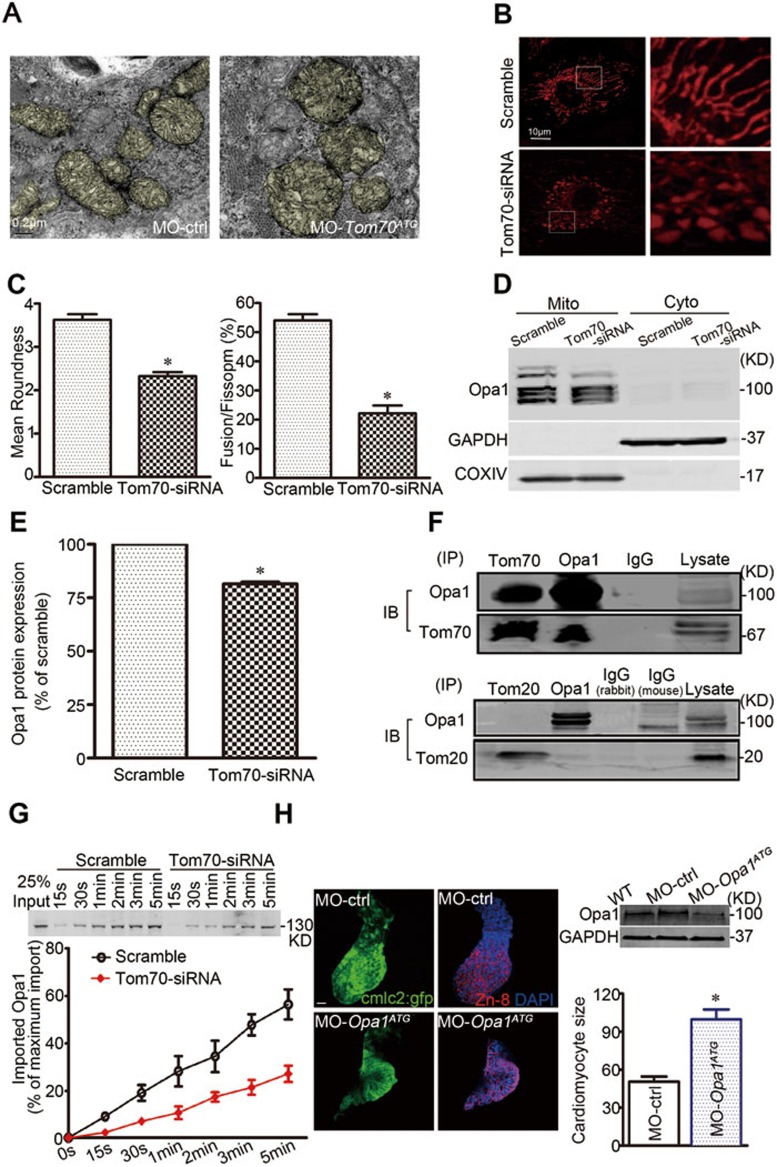
Figure 6.
Mitochondrial disorder contributes to oxidative stress and hypertrophic growth of Tom70-deficient cardiomyocytes. (A) Transmission electron microscopic examination of mitochondria from Tom70-deficient zebrafish hearts. (B) Effects of Tom70 knockdown on mitochondrial dynamics in primary cardiomyocytes. The cells were treated with Tom70 siRNA or scrambled siRNA for 48 h and were subsequently loaded with MitoTracker red. Images were obtained, and the boxed areas show magnifications (right). (C) Mitochondrial morphological change was analyzed as the mean roundness and fusion/fission ratio. (D) Western blot analysis of the mitochondria-shaping protein Opa1 in the Tom70-deficient cardiomyocytes. (E) Pooled data from five separate experiments in D. (F) Co-immunoprecipitation of Tom70 and Tom20 with Opa1 in normal primary cardiomyocytes. IP: immunoprecipitation. IB: immunoblotting. (G) In vitro import analysis of Opa1 in cardiomyocyte mitochondria. Top, representative western blots showing the time-dependent import of biotin-labeled Opa1 proteins. Bottom, pooled data. All the data were obtained from five separate experiments. (H) Inactivation of Opa1 resulted in hypertrophic growth of cardiomyocytes in zebrafish. Images of dissection of beating hearts followed by staining (blue = DAPI, green = GFP and red = Zn-8) at the indicated times. Bar: 10 μm. Upper right, western blot examination of Opa1 knockdown by MO-opa1ATG injection at 2 dpf. Lower right, quantification of the cardiomyocyte size from a total of 6-8 hearts per group. All the data were obtained from three independent experiments. *P < 0.05 versus the respective control using one-way ANOVA.

