
Fig. 3.
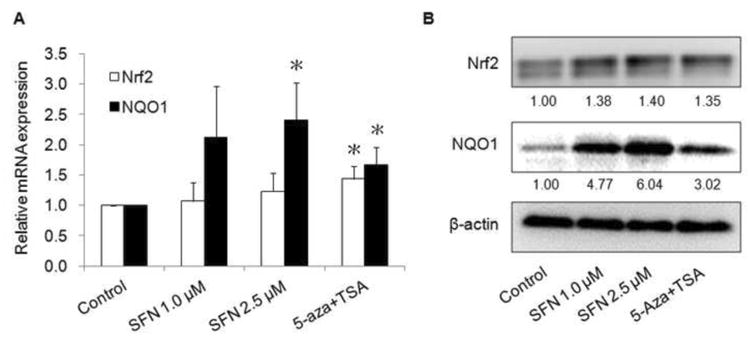
Effect of SFN on the mRNA (A) and protein (B) expressions of Nrf2 and NQO-1. After 5 days of treatment, mRNA and protein were isolated from TRAMP C1 cells as described above. The mRNA and protein levels of Nrf2 and NQO-1 were determined using qPCR and Western blotting, respectively. (A) The mRNA level was determined using ABI7900HT qPCR system. Data are expressed as mean ± SD from three independent experiments. * Different from control, P < 0.05. (B) For protein analysis, the bands which were bound with specific Nrf2 and NQO1 antibodies were visualized using a Gel Documentation 2000 system (Bio-Rad, Hercules, CA) and quantified using Quantity One software. β-Actin was used as an equal loading control.