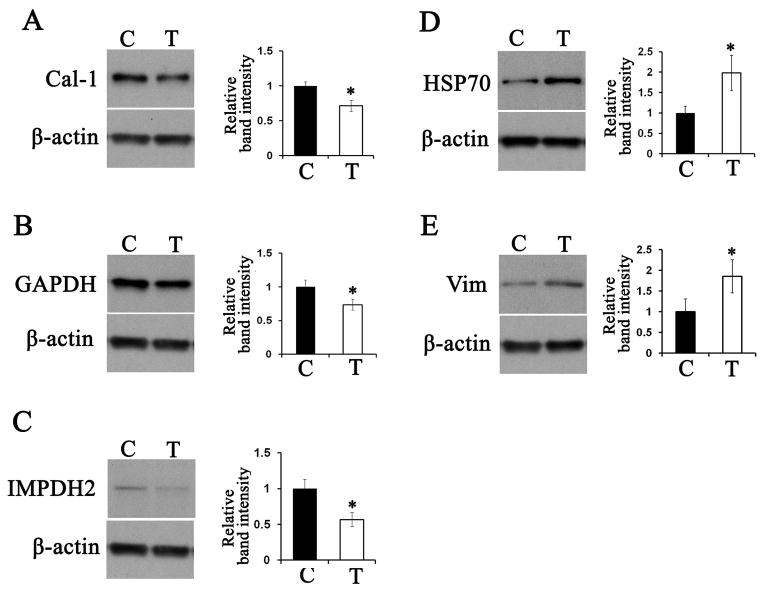
Figure 4.
Validation of 2D-gel proteomics results. Cells were treated with vehicle alone (C) or 5 μM 2′-OHCer (T) for 3 hr. Triplicate samples of crude cell lysates (10 μg protein) were subjected to immunoblot for caldesmon-1 (A), GAPDH (B), IMPDH2 (C), HSP70 (D) and vimentin (E). Each panel shows a representative immunoblot and relative abundance obtained by densitometry (normalized to β–actin). Statistical significance was determined by Student’s t test. *, P≤0.05.

