Figure 2.

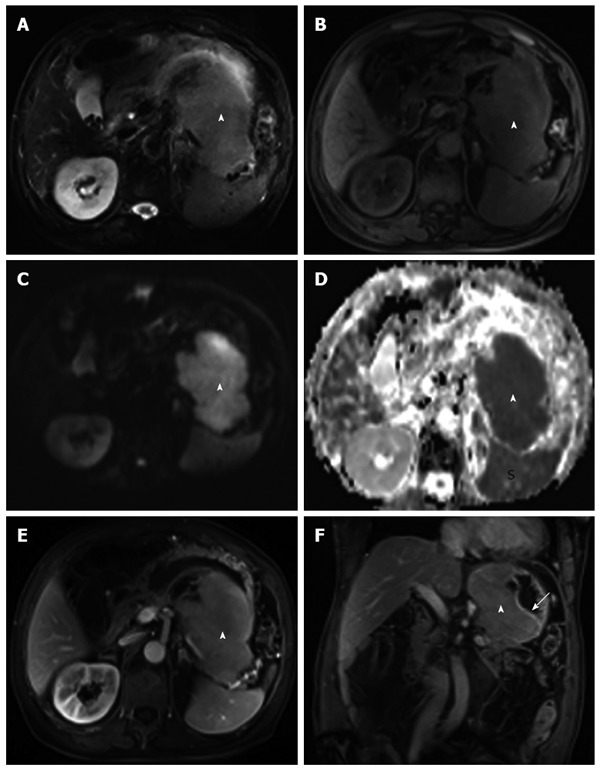
Magnetic resonance imaging. The lesion (arrowhead) was homogeneous and iso-hyperintense on T2-weighted images (A), iso-hypointense on T1-weighted images (T1WI) (B), clearly hyperintense on diffusion-weighted imaging (C) and hypointense on the apparent diffusion coefficient map (D). The mass (arrowhead) under the hyperintense gastric mucosa (arrow) was gradual and homogeneous for enhancement at 60 s (E) and 190 s (F) after gadolinium injection, as revealed by transverse and coronal T1WI. S: Spleen.
