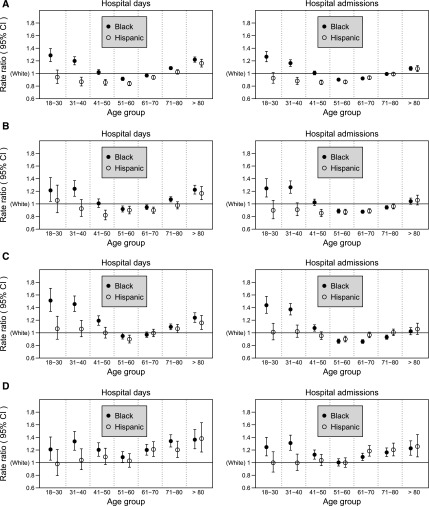
Figure 1.
Adjusted rate ratios of hospital days and admissions for blacks and Hispanics compared with whites by age group. (A) All causes. (B) Cardiovascular diseases. (C) All-cause infection. (D) Dialysis-related infection. The error bars represent 95% confidence intervals (95% CIs). All P values for the interaction between race/ethnicity and age were <0.001, except for P=0.05 for the hospital days due to dialysis-related infection.

