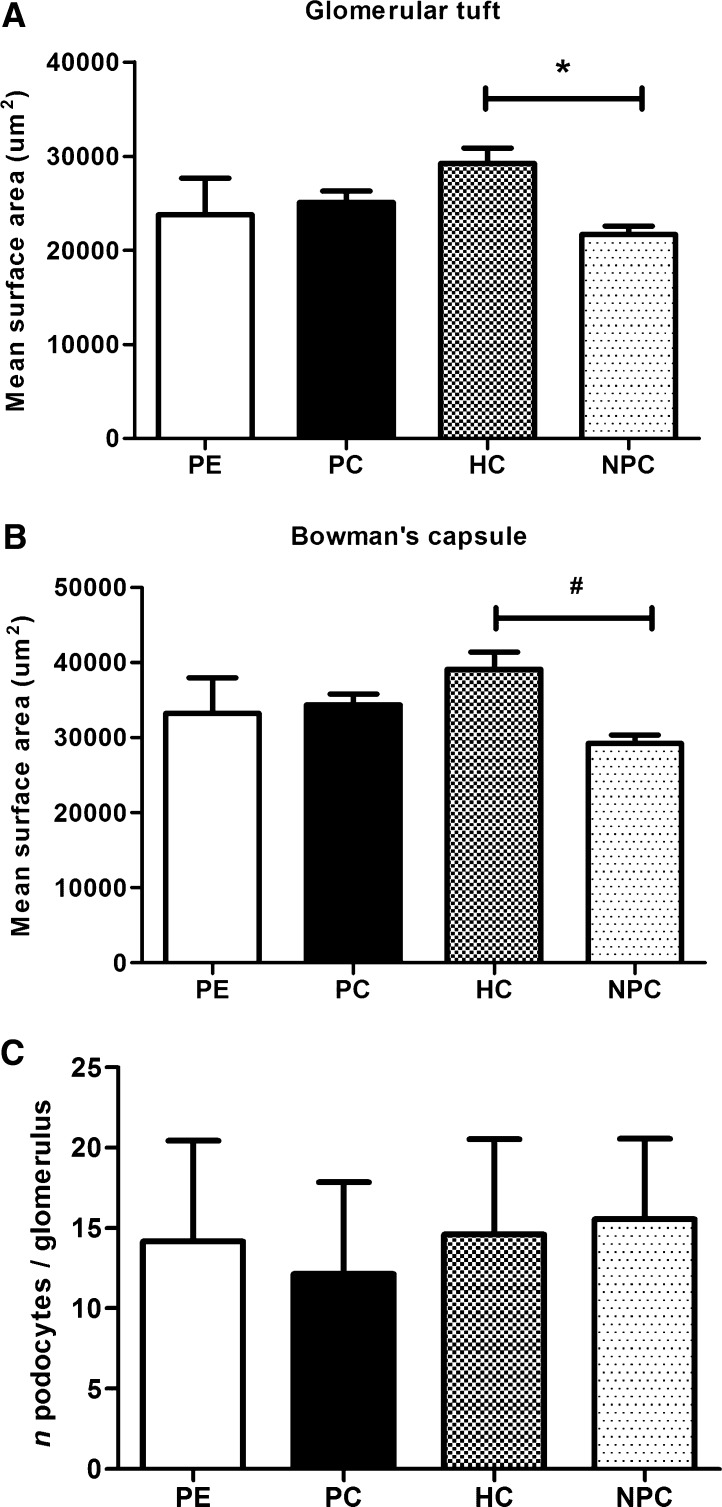
Figure 1.
Morphometric analysis and podocyte number. (A and B) Glomerular surface areas were calculated for the glomerular tuft (A; *P=0.003) and Bowman’s capsule (B; #P=0.002) in patients with preeclampsia and the control groups. (C) Number of WT-1–positive podocytes per glomerulus in the women with preeclampsia and the control groups. The error bars represent SDs. HC, hypertensive nonpregnant control; NPC, normotensive nonpregnant control; PC, normotensive pregnant control; PE, preeclampsia; WT-1, Wilms’ tumor-1.

