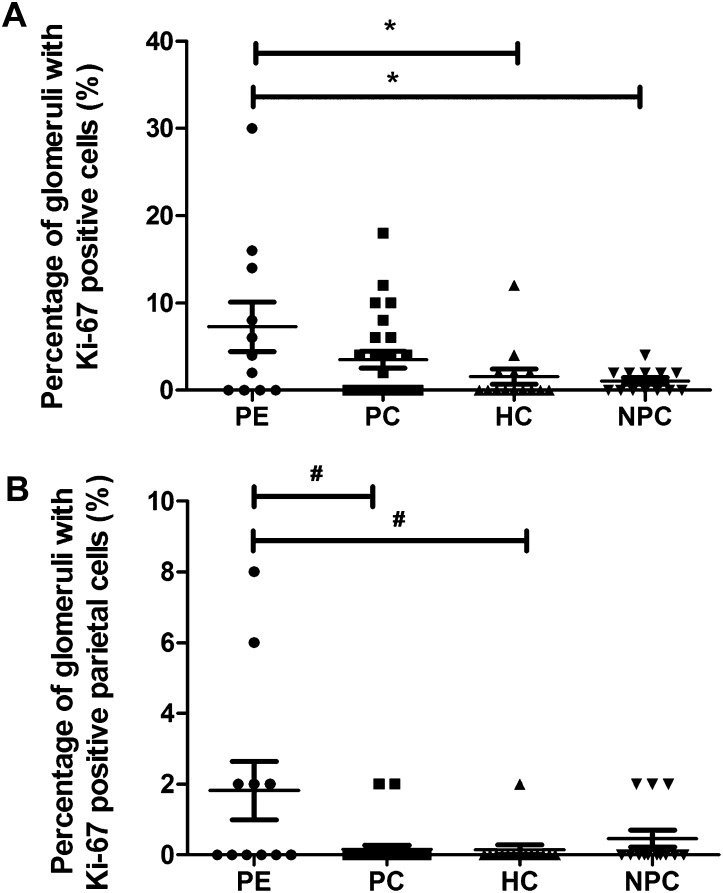
Figure 2.
Ki-67 analysis. (A) The percentage of glomeruli with Ki-67–positive cells (*P=0.004). (B) Percentage of glomeruli with Ki-67–positive parietal epithelial cells (#P=0.02). In A and B, each symbol represents an individual patient or control. The lines represent the mean value, and the error bars represent the SD.

