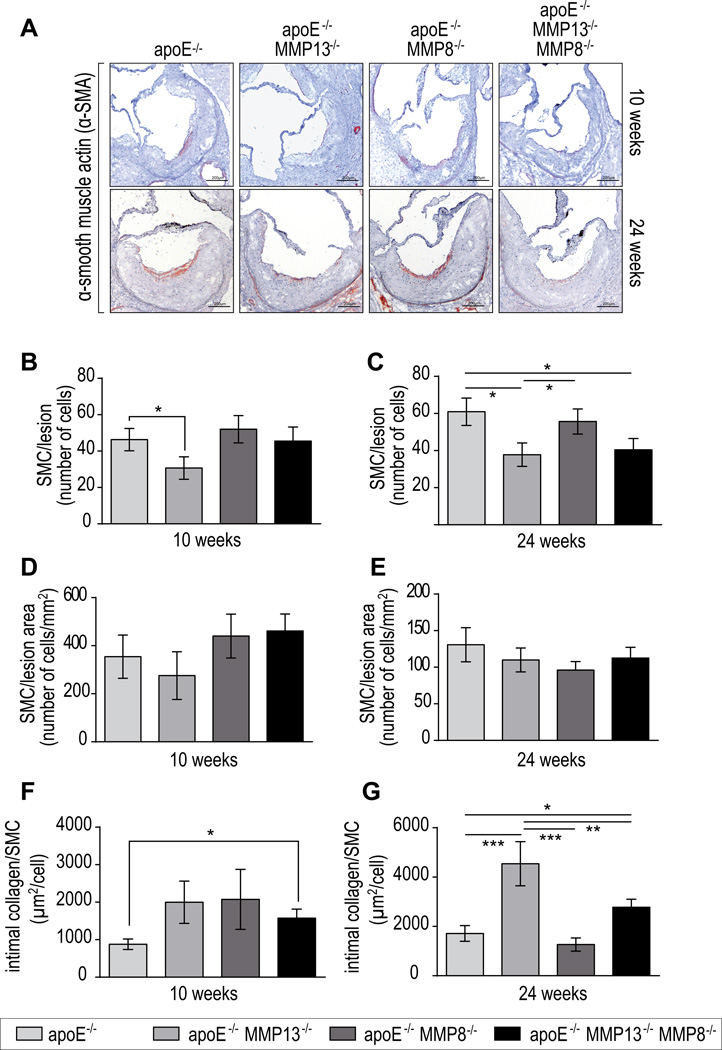
Figure 4.
Representative alpha-smooth mucle cell (SMC) actin staining of aortic root sections of KO mice after 10 and 24 weeks on atherogenic diet (A). Quantification of smooth muscle cells number per lesion and per lesion area after 10 weeks (B,D) and 24 weeks of atherogenic diet (C,E). Intimal collagen content normalized by the number of SMCs in early (F) and advanced lesions (G). Bars represent mean ± SEM. (n≥10 per group, *p<0.05, **p<0.01, ***p<0.001).

