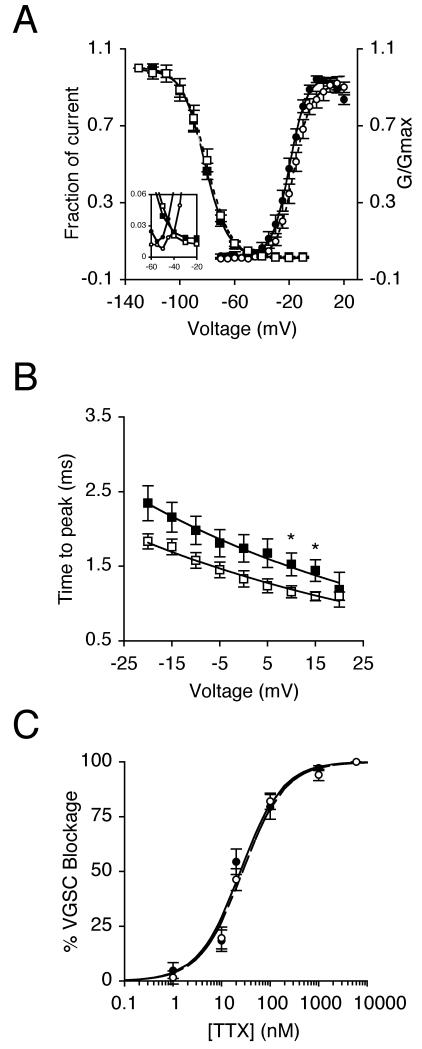
Figure 2. NGF decreased time to peak but did not affect TTX sensitivity.
(A) Mean availability- voltage (squares) and relative conductance (G/Gmax)-voltage relationships (circles) for control cells (dark symbols) and cells pre-treated with 20 ng/ml NGF for 24 h (light symbols). Control (solid lines) and NGF data (dotted lines) are fitted with Boltzmann functions. Inset magnifies a window in which current is activated and not fully inactivated. (B) Dependence of time to peak on membrane voltage for control cells (dark squares), and cells treated with 20 ng/ml NGF for 24 h (light squares). Control (solid line) and NGF data (dashed line) are fitted with single exponential functions. (C) Reduction of VGSC current by TTX for control cells (dark circles), and cells treated with 20 ng/ml NGF for 24 h (light circles). Control (solid line) and NGF data (dashed line) are fitted to Langmuir adsoption isotherms. Data are presented as mean ± SEM (n > 17). Significance: (*) P < 0.05; Student’s t test.

