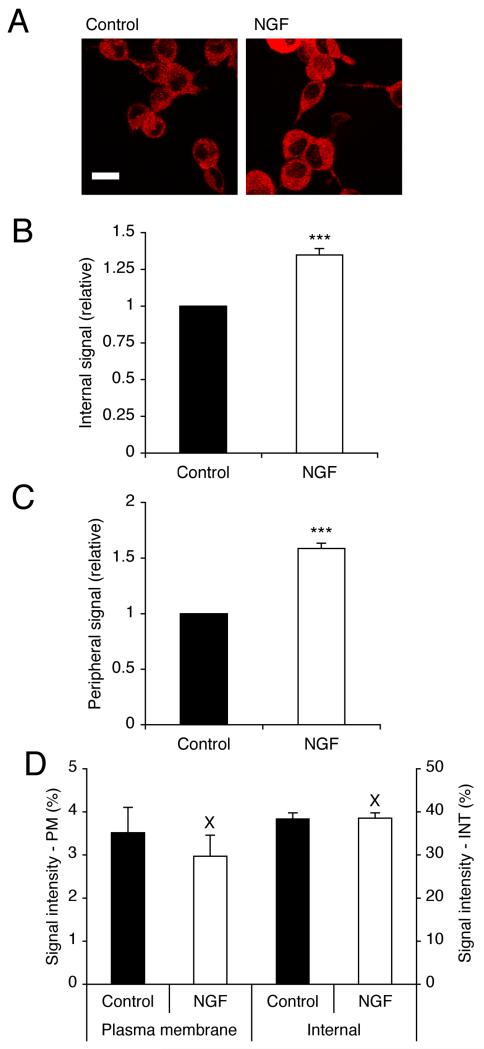
Figure 5. NGF increased VGSC immunoreactivity internally and at the plasma membrane.
(A) Typical confocal images of control cells, and cells treated with NGF (20 ng/ml) for 24 h, immunolabelled with pan-VGSC α-subunit antibody. Scale bar, 15 μm. (B) Relative internal VGSC protein level in control cells, and cells treated with NGF (20 ng/ml) for 24 h. (C) Relative peripheral VGSC protein level in control cells, or cells treated with NGF (20 ng/ml) for 24 h. (D) VGSC protein distribution along subcellular cross-sections (%). Left-hand bars, 1.5 μm sections measured inward from edge of concanavalin A staining; Right-hand bars, middle 30 % of cross-section. PM, plasma membrane; INT, internal. Data are presented as mean and SEM (B, C n = 90; D, n = 20). Significance: (X) P > 0.05; (***) P < 0.001; Student’s t test.

