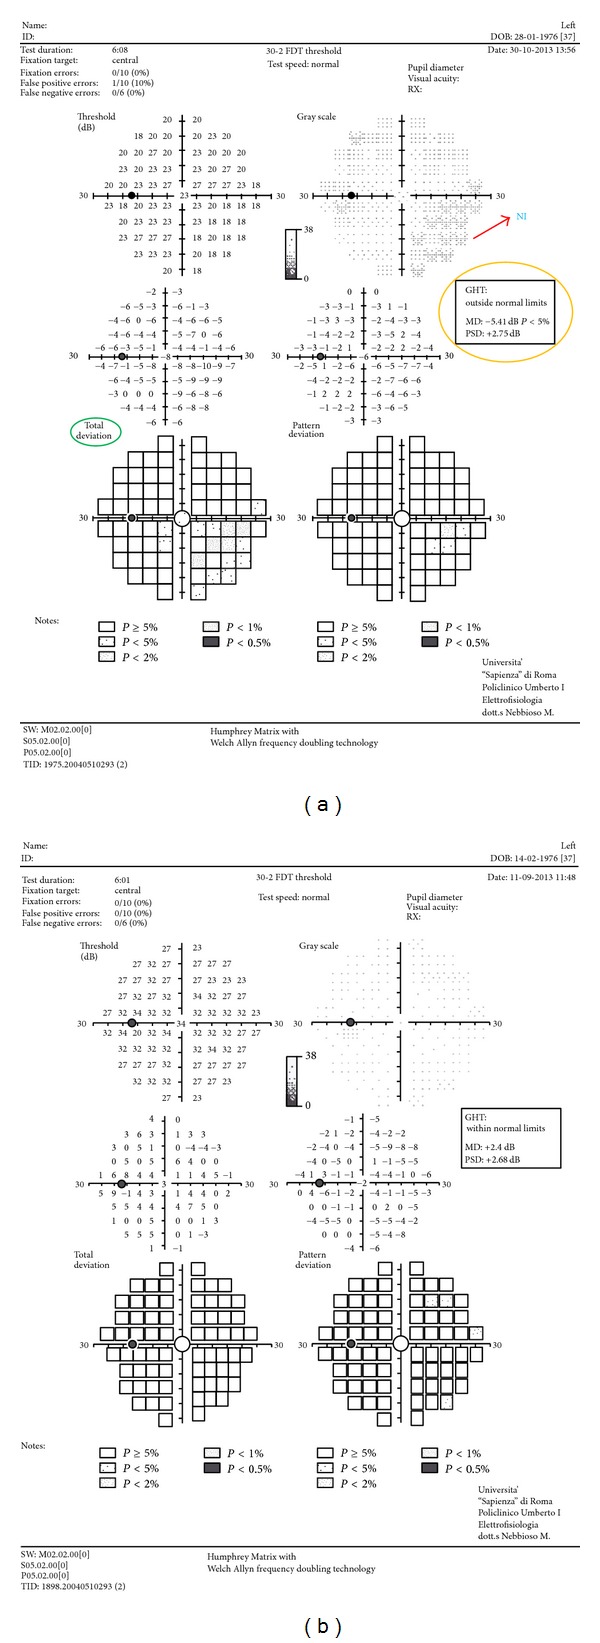
Figure 1.

The output data from the frequency doubling technology (FDT) perimetry includes number, location, and severity of the defects in the 69 target zones. Readings appear as a numerical table and as probability maps with five gray tones. (a) Abnormal glaucoma hemifield test (GHT) and mean deviation (MD) at FDT perimetry with decreased average responses of a patient versus control subject from an age-normalized database (see total deviation). In particular, decreased average responses in nasal-inferior quadrant (NI); GHT: outside normal limits; and MD: −5.41 dB (P < 5%). (b) FDT of control.
